AWS Account monitoring with Topologix
Cloud & CDN
Account-level AWS from one credential — a single integration feeds five kinds of card, chosen per metric source: Cost (real spend from Cost Explorer with a month-end forecast), Waste (billed-but-unused resources proven by state), Inventory (a per-region census), Account (identity and reachability — a credential-rotation canary), and Health (what AWS itself says is broken, scoped to the services and regions you actually run in). It reads no CloudWatch at all; per-resource utilization stays with the individual AWS integrations.
Requirements
- An IAM access key covering the read-only calls the modes actually make:
sts:GetCallerIdentity,ec2:DescribeRegions/DescribeInstances/DescribeVolumes/DescribeAddresses/DescribeSnapshots/DescribeImages,rds:DescribeDBInstances,elasticloadbalancing:DescribeLoadBalancers, ands3:ListAllMyBuckets. The managedReadOnlyAccesspolicy covers all of them. - For the Cost card,
ce:GetCostAndUsageandce:GetCostForecast— and the forecast is a separate grant:AWSBillingReadOnlyAccesscarriesGetCostAndUsagebut notGetCostForecast, so list the twoce:actions individually in an inline policy for a tight setup. - Cost awareness, not a permission: Cost Explorer requests bill real money (see the notes below), so the 12-hour cache is part of the design, not an optimization.
- For the Health card, nothing at all for the public half — AWS’s current-events feed is an unauthenticated GET, so a Health source works on an integration with no key. Account-specific events additionally need
health:DescribeEvents/health:DescribeEventDetailsand a Business, Enterprise On-Ramp or Enterprise support plan: on Basic or Developer support the AWS Health API answersSubscriptionRequiredExceptionfor everyone, whatever the IAM policy says.
1 · Set up the integration
- Open the Integrations pageClick Integrations in the toolbar and pick AWS Account from the catalogue.
- Create the read-only credentialAn IAM user (or role) with the policies above. The fetcher is GET-only by construction — every command it imports is a Describe/Get/List, and a parse-check greps the source to keep it that way.
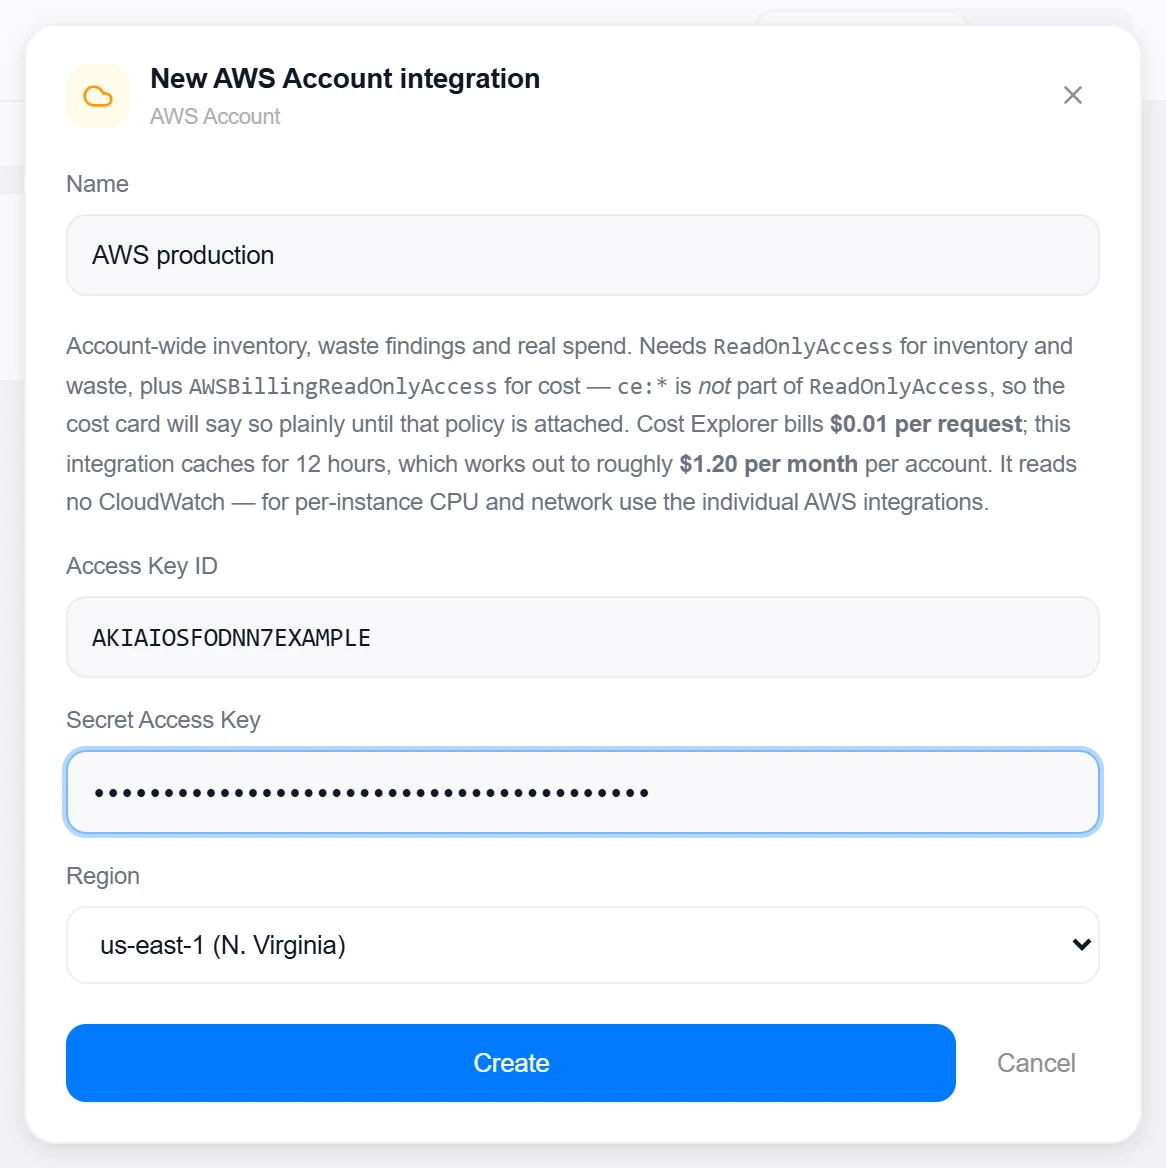
- Enter the credentialsAccess Key ID, Secret Access Key, and the home Region — used for the global calls and as the sole scan region unless a source opts into sweeping every enabled region.
- Create, then verifyClick Create, then reopen the integration and click Test — it resolves the account via
sts:GetCallerIdentity, probesec2:DescribeRegions, and reports each result honestly. It deliberately does not probe Cost Explorer, because every probe would bill $0.01.

Target on a private network? Route it through a proxy agent. Proxy agents run inside your network — behind NAT, on a management VLAN, in an air-gapped segment — and reach targets the Topologix server can't. The agent polls the server every 15 seconds for its assignments, runs the checks locally, and pushes results back every 5 seconds, so no inbound firewall rules are ever needed. Set a default proxy on the integration; every metric source can override it. If a proxy goes offline, its sources are marked stale within ~90 seconds and the last known values stay visible.
2 · Add it to a flow
- Select the cloud nodeClick the node, open Metrics, then + Add and choose the AWS Account integration.
- Pick the modeFive tabs under What to monitor: Cost (month to date, last complete month, per-service breakdown, forecast — amortized cost as the headline, unblended cash beside it), Waste (unused-but-billed, proven by state), Inventory (EC2 by state, EBS GiB, Elastic IPs, snapshots, RDS, load balancers, S3 buckets per region), Account (which account the key belongs to and whether it still works), Health (AWS’s own open service events for the services and regions you name).
- SaveOptionally tick Scan every enabled region (off by default — a full sweep is roughly 13 describes per region, and the card always states how many regions it actually read; Cost ignores the toggle, since Cost Explorer is account-wide, and on Health it is a filter rather than a sweep), set a card label and the interval, and click Add Source. On Health, fill in Services and Regions first — see the note below.
Live canvas screenshots for this integration require a real AWS Account environment, so this guide shows the configuration screens only — the flow steps above work exactly like every other integration.
Good to know
- Cost Explorer costs real money — the fetcher’s own comment puts it plainly: “ce:GetCostAndUsage and ce:GetCostForecast bill $0.01 PER REQUEST against the primary billing view, with no free tier.” Results are cached for 12 hours (≈ $1.20/month per account) with a hard 1-hour floor enforced in code, and the cache is keyed on the credential, so five cards on one account share one pair of requests.
- Cost and forecast availability are separate flags: on the common
AWSBillingReadOnlyAccesssetup, month-to-date works while the forecast plainly says it can’t — and a denied Cost Explorer renders as a stated fact, never as $0.00. Cost Explorer itself lives only in us-east-1, whatever region the integration uses. - Waste is proven by state, never guessed from utilization: unattached EBS volumes, Elastic IPs associated with nothing, stopped instances still paying for their disks, snapshots whose source volume is gone (AMI-aware, so image-backing snapshots are never flagged), and load balancers with no registered targets. Idle-but-running detection would need CloudWatch, which this integration deliberately never reads.
- Health reads two independently degradable feeds. The public current-events feed is what the AWS Health Dashboard itself consumes — unauthenticated, global, and available to every account. The account feed is the AWS Health API, which is personalised to your resources but gated behind a Business or Enterprise support plan. Each carries its own availability flag with a verbatim reason, so a card can truthfully say “AWS reports no public event for the services you track; account-specific events need a Business or Enterprise support plan” — it never collapses an unreadable feed into “0 events”, and two unreadable feeds give a verdict of unknown, never green.
- Scoping by service and region is what makes the Health card usable. AWS’s feed is global: it routinely carries open events in regions you have never deployed to, and an unscoped card sits red forever on somebody else’s outage. Name the services (
cloudfront,ec2,s3) and the regions you actually run in and the card only reacts to events that reach you — globally-scoped services such as CloudFront and Route 53 match any region filter, because that is how AWS keys them. An event also matches when it lists one of your services as currently impacted; a service it merely touched and has since released is shown as recovered and never raises the alarm, which is the mirror-image mistake of a card that goes green during an outage. - AWS publishes no Atlassian Statuspage — both
health.aws.amazon.comandstatus.aws.amazon.comanswer 404 on/api/v2/summary.json— so the Status Page integration can never track AWS. This mode is the replacement, and it reads AWS’s own words: service name, region name (“UAE”, not a code we translated) and event summary all render verbatim, so the card and the AWS Health Dashboard cannot disagree about what happened.
More Cloud & CDN integrations
See it on your own infrastructure
Book a demo and we will walk you through Topologix with your systems in mind: on our cloud, or self-hosted in your own network.