UpCloud monitoring with Topologix
Cloud & CDN
Whole-account UpCloud monitoring from one credential — servers, storage, managed databases, load balancers, Kubernetes, object storage, gateways, networks, file storage, private-cloud hosts, and account quotas. Each resource family is its own metric source, and every family rolls up to the same “needs attention” metric so one alert rule covers the account.
Requirements
- An API token (recommended — it can carry an expiry and be locked to source IP ranges) or username/password Basic auth, UpCloud’s legacy method that can’t be scoped or expired.
- UpCloud has no read-only role: any credential that can read the API could also modify resources. Topologix only ever issues
GETrequests, but treat the credential as privileged — dedicated subaccount, IP allowlist, expiry.
1 · Set up the integration
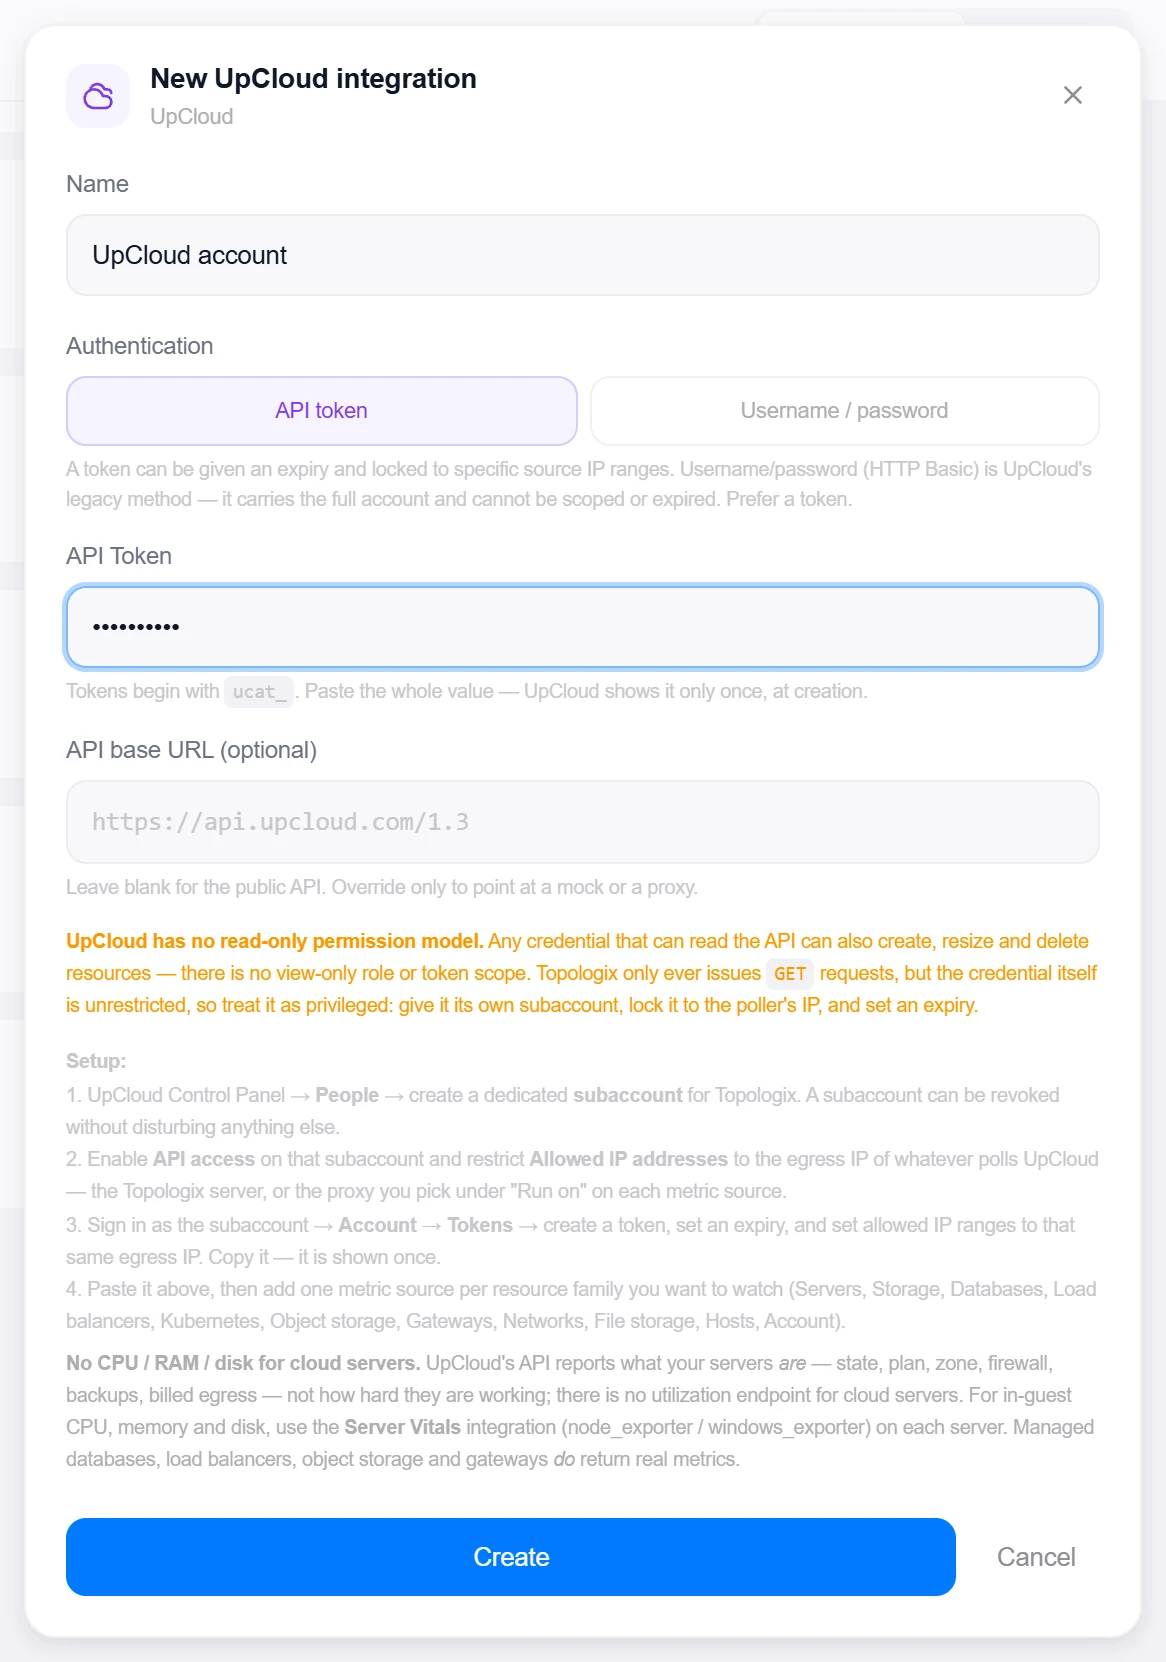
- Open the Integrations pageClick Integrations in the toolbar and pick UpCloud from the catalogue.
- Create a scoped tokenControl Panel → People → a dedicated subaccount with API access, then sign in as it and go to Account → Tokens: create a token (
ucat_…, shown once) with an expiry and allowed IP ranges restricted to the poller’s egress IP — the Topologix server, or the proxy agent you pick under Run on on each metric source. - Paste and testChoose API token (or Username / password), paste the credential, and leave API base URL blank for the public API. Click Create, then reopen the integration and click Test — it reads the account and lists servers, reporting the account username, visible server count, and credits. Permissions are resource-scoped, so the test proves listing actually works rather than stopping at “authenticated”.

Target on a private network? Route it through a proxy agent. Proxy agents run inside your network — behind NAT, on a management VLAN, in an air-gapped segment — and reach targets the Topologix server can't. The agent polls the server every 15 seconds for its assignments, runs the checks locally, and pushes results back every 5 seconds, so no inbound firewall rules are ever needed. Set a default proxy on the integration; every metric source can override it. If a proxy goes offline, its sources are marked stale within ~90 seconds and the last known values stay visible.
2 · Add it to a flow
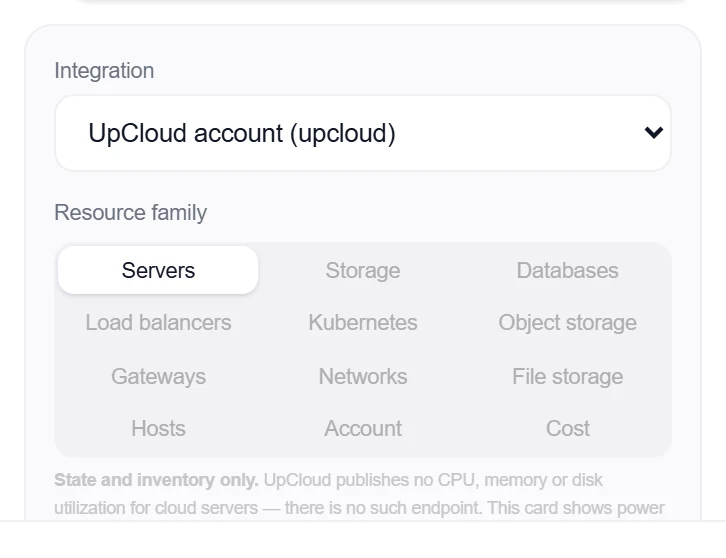
- Select the cloud nodeClick the node, open Metrics, then + Add and choose the UpCloud integration.
- Pick the resource familyTwelve tabs — Servers, Storage, Databases, Load balancers, Kubernetes, Object storage, Gateways, Networks, File storage, Hosts, Account, Cost — each with its own options (zone filter, tag filter, a single-resource UUID, stale-backup days…). One integration happily feeds a Servers card, a Databases card, and an Account card at the same time.
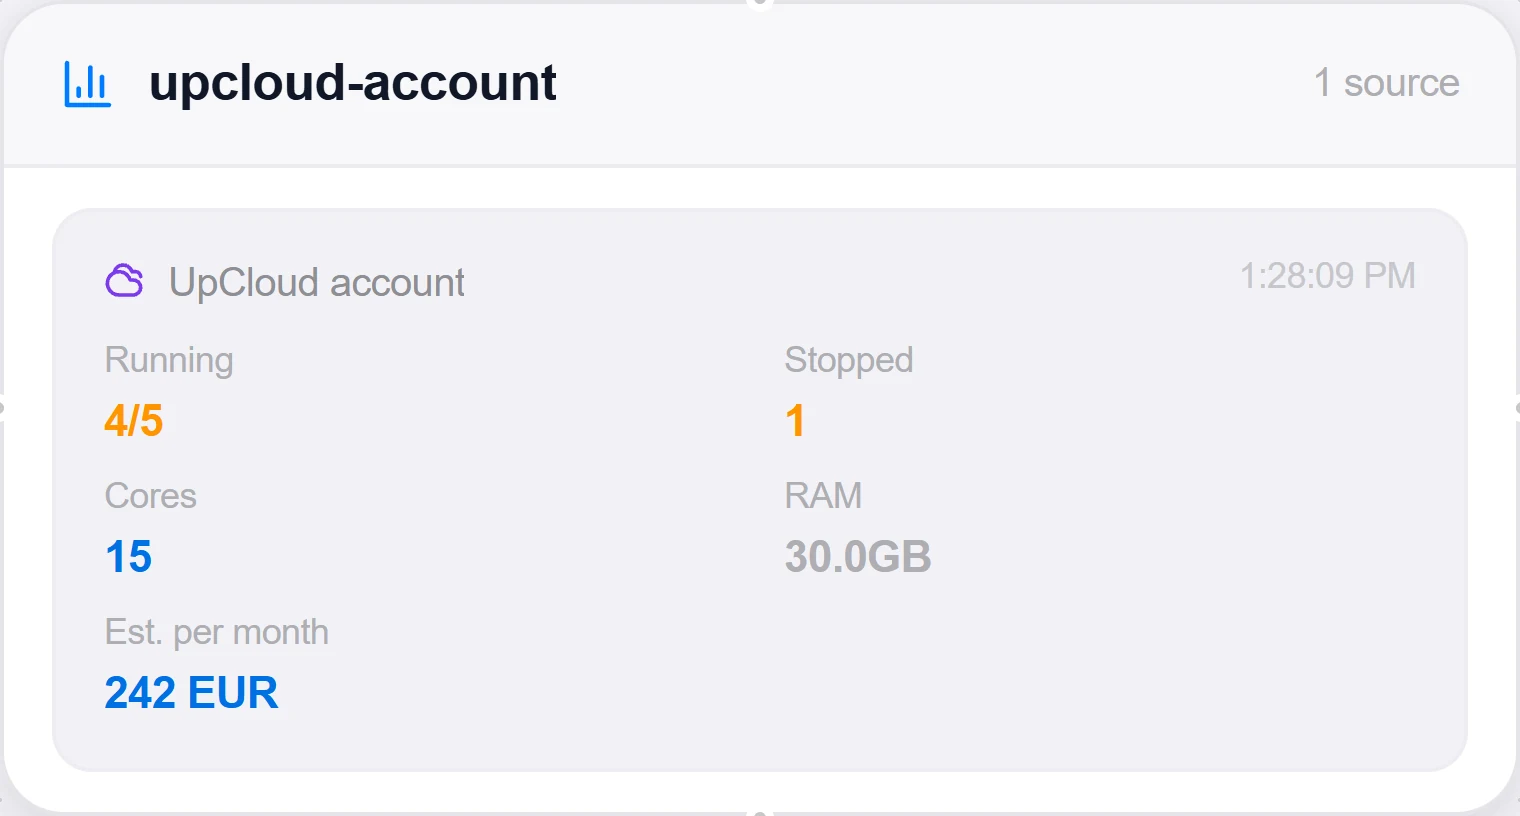
- SaveSet the interval and click Add Source. Managed databases, load balancers, object storage, and gateways chart real vendor time-series (CPU/memory/disk, per-backend-member health, bytes and object counts, IPsec tunnel state); Servers and Storage are state + inventory; Account tracks credits, quotas, and the transfer pool; Cost estimates monthly list-price spend from your live inventory.
Good to know
- No CPU / RAM / disk for cloud servers — UpCloud’s API has no utilization endpoint for them, so the Servers card is state, plan, firewall, backup coverage, and billed egress. In-guest figures come from a Server Vitals integration on each server.
- UpCloud publishes no rate limits, so collection defends itself: tiered inventory caching, staggered refresh, a hard per-tick API call budget, and 429 backoff. A source that hits its budget says so instead of half-reporting silently.
- Attention rows quote UpCloud’s own status strings verbatim (
check_status, state messages, last-down messages) — the card never re-words a vendor enum, so what you see matches the UpCloud control panel.
More Cloud & CDN integrations
See it on your own infrastructure
Book a demo and we will walk you through Topologix with your systems in mind: on our cloud, or self-hosted in your own network.