Cloudflare monitoring with Topologix
Cloud & CDN
Zone analytics straight from Cloudflare’s GraphQL Analytics API — either an HTTP Requests card (requests, 4xx/5xx, cache hit ratio, and firewall events for a whole zone or a single hostname/path) or a Site Overview card that fans out to five datasets at once: web performance with edge-TTFB percentiles, cache efficiency in requests and bytes, security events by action, DNS analytics, and RUM Core Web Vitals.
Requirements
- A Cloudflare API token with Zone → Analytics → Read on the zones you monitor, plus Account → Analytics → Read for the account-scoped Web Vitals dataset. Use a custom token — not the Global API Key, which is deprecated and overly permissive.
- Dataset availability varies with the zone’s plan: Cloudflare gates some GraphQL datasets and their retention windows by tier (Free covers the HTTP basics; some datasets need a Pro or Business zone). A gated dataset degrades its overview section to “not available” instead of failing the source.
- Two overview sections carry prerequisites of their own: DNS analytics needs the zone’s DNS hosted on Cloudflare, and Core Web Vitals needs a Web Analytics site tag.
1 · Set up the integration
- Open the Integrations pageClick Integrations in the toolbar and pick Cloudflare from the catalogue.
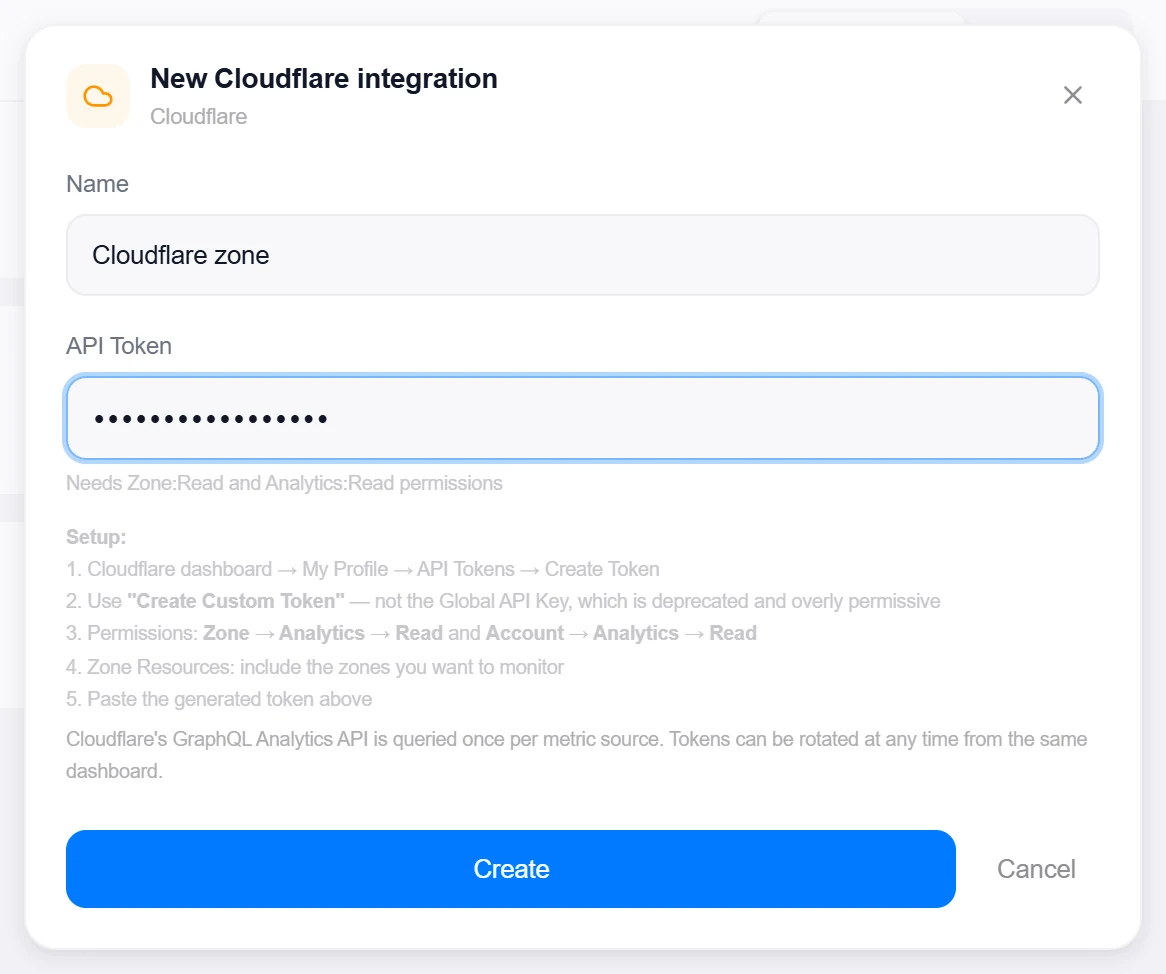
- Create a custom tokenCloudflare dashboard → My Profile → API Tokens → Create Token → Create Custom Token. Permissions: Zone → Analytics → Read and Account → Analytics → Read; Zone Resources: include the zones you want to monitor. Tokens can be rotated at any time from the same screen.
- Paste and testThe drawer has exactly one field — API Token. Click Create, then reopen the integration and click Test — it lists the zones the token can see and reports “Connected. Found N zone(s).”

Target on a private network? Route it through a proxy agent. Proxy agents run inside your network — behind NAT, on a management VLAN, in an air-gapped segment — and reach targets the Topologix server can't. The agent polls the server every 15 seconds for its assignments, runs the checks locally, and pushes results back every 5 seconds, so no inbound firewall rules are ever needed. Set a default proxy on the integration; every metric source can override it. If a proxy goes offline, its sources are marked stale within ~90 seconds and the last known values stay visible.
2 · Add it to a flow
- Select the nodeClick the node, open Metrics, then + Add and choose the Cloudflare integration.
- Pick the type and zoneA Type toggle chooses HTTP Requests or Site Overview, and the DNS Zone dropdown is filled from the token (or paste a zone ID). Requests mode adds an optional URL / Host filter — a hostname, or a path starting with
/, with*wildcards; overview mode adds the optional Web Analytics site tag that switches on the Core Web Vitals section. - SavePick the period (1 minute to 24 hours — overview enforces at least 5 minutes, because it fans out ~5 queries against datasets that lag a little) and click Add Source.
Live canvas screenshots for this integration require a real Cloudflare environment, so this guide shows the configuration screens only — the flow steps above work exactly like every other integration.
Good to know
- Every Site Overview dataset is its own GraphQL query behind
Promise.allSettled— a dataset the token, zone, or plan can’t serve nulls only its section, never the whole tick. - Cache hit ratio counts
hit,stale,updating, andrevalidatedas cached — the same statuses Cloudflare itself treats as “served from cache”. - A filter starting with
/matches the request path, anything else matches the request host, and*becomes a GraphQL wildcard — so/api/v1/*and*.example.comboth work.
More Cloud & CDN integrations
See it on your own infrastructure
Book a demo and we will walk you through Topologix with your systems in mind: on our cloud, or self-hosted in your own network.