Firebase monitoring with Topologix
Analytics & Apps
Firebase project health through one service account — 12 presets across four backends: Firestore reads/writes/deletes, Cloud Function invocations and errors, Realtime Database connections, and Hosting/Storage bandwidth from Cloud Monitoring; Crashlytics crashes, non-fatal errors, and ANRs from the Cloud Logging export; and total Auth users from the Identity Toolkit API.
Requirements
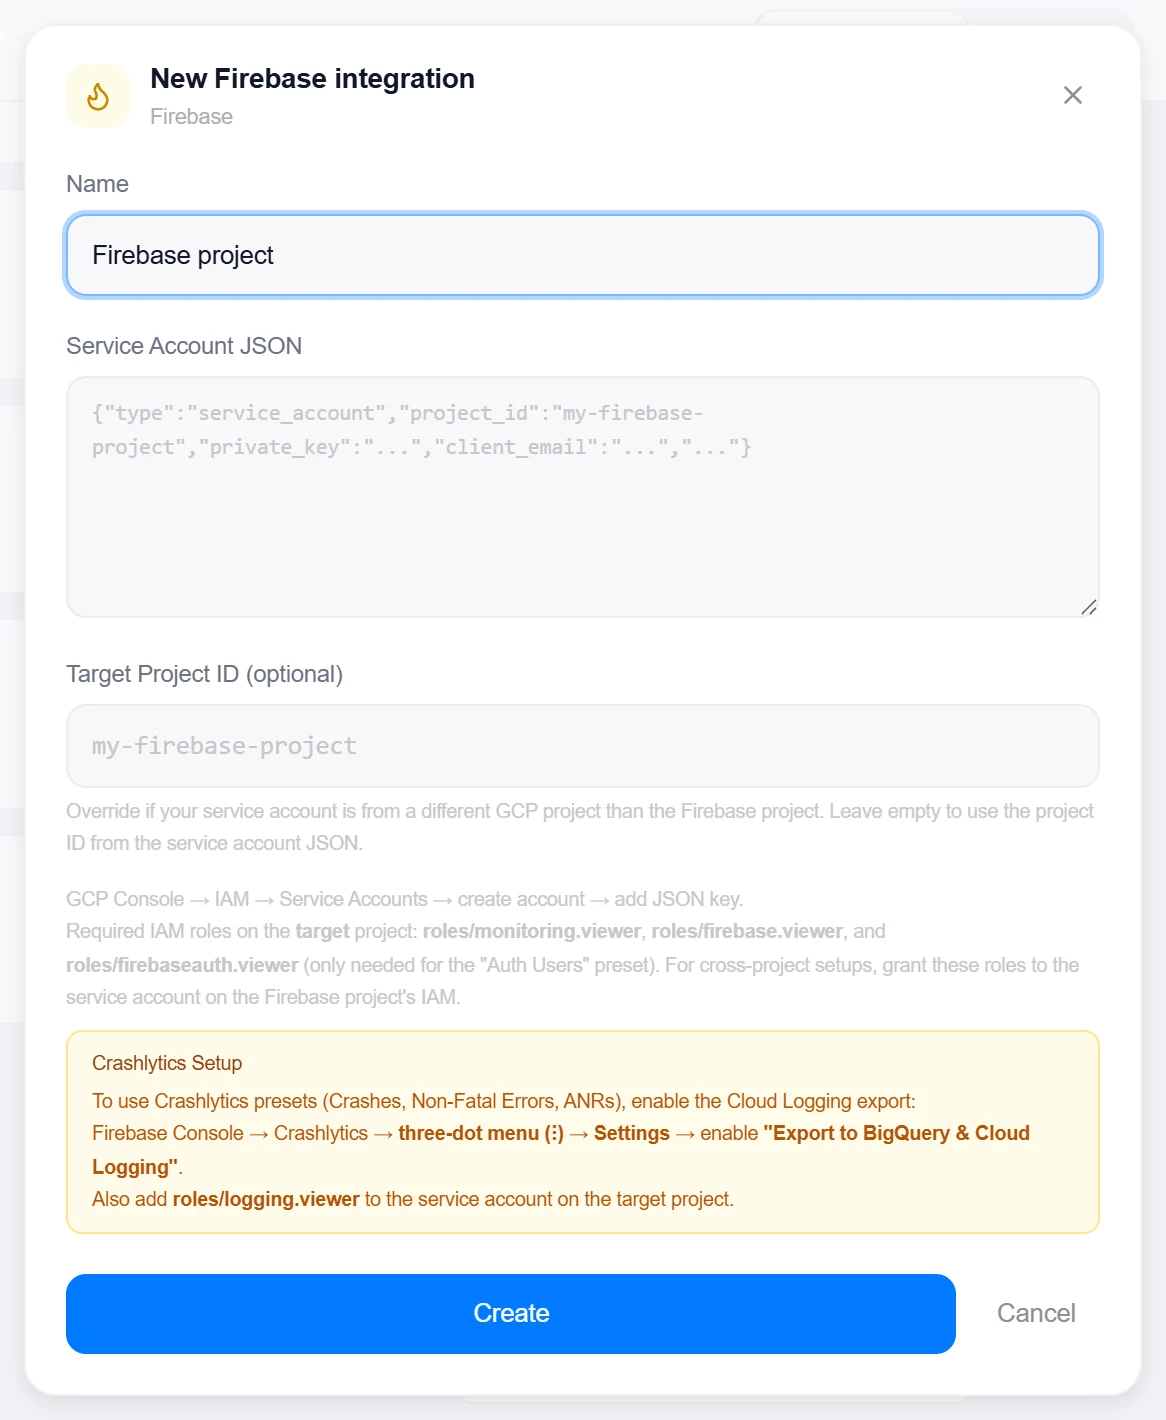
- A service account JSON key with these roles on the target project: roles/monitoring.viewer and roles/firebase.viewer; roles/firebaseauth.viewer only for the Auth Users preset; roles/logging.viewer for the Crashlytics presets. The token is requested with read-only scopes across the board.
- For the Crashlytics presets, enable the export first: Firebase Console → Crashlytics → three-dot menu (⋮) → Settings → “Export to BigQuery & Cloud Logging”.
1 · Set up the integration
- Open the Integrations pageClick Integrations in the toolbar and pick Firebase from the catalogue.
- Create the service accountGCP Console → IAM → Service Accounts → create an account and add a JSON key, then grant the roles above — for cross-project setups, grant them on the Firebase project’s IAM.
- Paste the JSONDrop the key into Service Account JSON — the drawer echoes the detected project. The optional Target Project ID override covers a service account that lives in a different GCP project than the Firebase project.
- Create, then verifyClick Create, then reopen the integration and click Test — it reads the project from the Firebase Management API and reports “Connected — project <name>”; a 403 names the missing viewer roles.

Target on a private network? Route it through a proxy agent. Proxy agents run inside your network — behind NAT, on a management VLAN, in an air-gapped segment — and reach targets the Topologix server can't. The agent polls the server every 15 seconds for its assignments, runs the checks locally, and pushes results back every 5 seconds, so no inbound firewall rules are ever needed. Set a default proxy on the integration; every metric source can override it. If a proxy goes offline, its sources are marked stale within ~90 seconds and the last known values stay visible.
2 · Add it to a flow
- Select the nodeClick the node, open Metrics, then + Add and choose the Firebase integration.
- Pick the metricThe Metric list shows every preset tagged with its backend —
cloud monitoringoridentity toolkit. Time-windowed presets get a Range picker (5 minutes / 1 hour / 24 hours / 7 days); Auth Users has none — it’s a live total, not a window. - SaveOptionally set a label, pick the interval, and click Add Source.
Live canvas screenshots for this integration require a real Firebase environment, so this guide shows the configuration screens only — the flow steps above work exactly like every other integration.
Good to know
- Monitoring presets aggregate the whole range in a single
timeSeriescall — sums for the counters, means for gauges like RTDB connections. - Auth Users pages the Identity Toolkit 1,000 accounts at a time with a 10-page cap, so past 10,000 users the card honestly reads “10k+” instead of a wrong exact number.
- Crashlytics presets count entries in the
firebasecrashlyticsevents log filtered by error type —FATAL,NONFATAL, orANR— over the chosen range.
More Analytics & Apps integrations
See it on your own infrastructure
Book a demo and we will walk you through Topologix with your systems in mind: on our cloud, or self-hosted in your own network.