Google Analytics monitoring with Topologix
Analytics & Apps
GA4 web analytics on the canvas through a service account — 16 presets: 12 straight off the GA4 Data API (realtime active users, users/sessions/pageviews/events over 1-to-28-day windows, engagement and bounce rates) plus 4 near-real-time BigQuery presets that query the GA4 streaming export over 1-minute to 30-minute windows.
Requirements
- A GA4 property and a GCP service account JSON key, with the service-account email added as Viewer under GA4 → Admin → Property Access Management.
- No OAuth dance: the server signs a JWT with the key and exchanges it for a token scoped
analytics.readonly+bigquery.readonly, refreshed automatically every hour. - For the “(BigQuery)” presets only: GA4 → Admin → BigQuery Links with Streaming enabled, and the service account granted BigQuery Data Viewer on the GA4 dataset plus BigQuery Job User on the project.
1 · Set up the integration
- Open the Integrations pageClick Integrations in the toolbar and pick Google Analytics from the catalogue.
- Create the service accountGCP Console → IAM → Service Accounts → create an account and add a JSON key, then grant that email Viewer on the GA4 property.
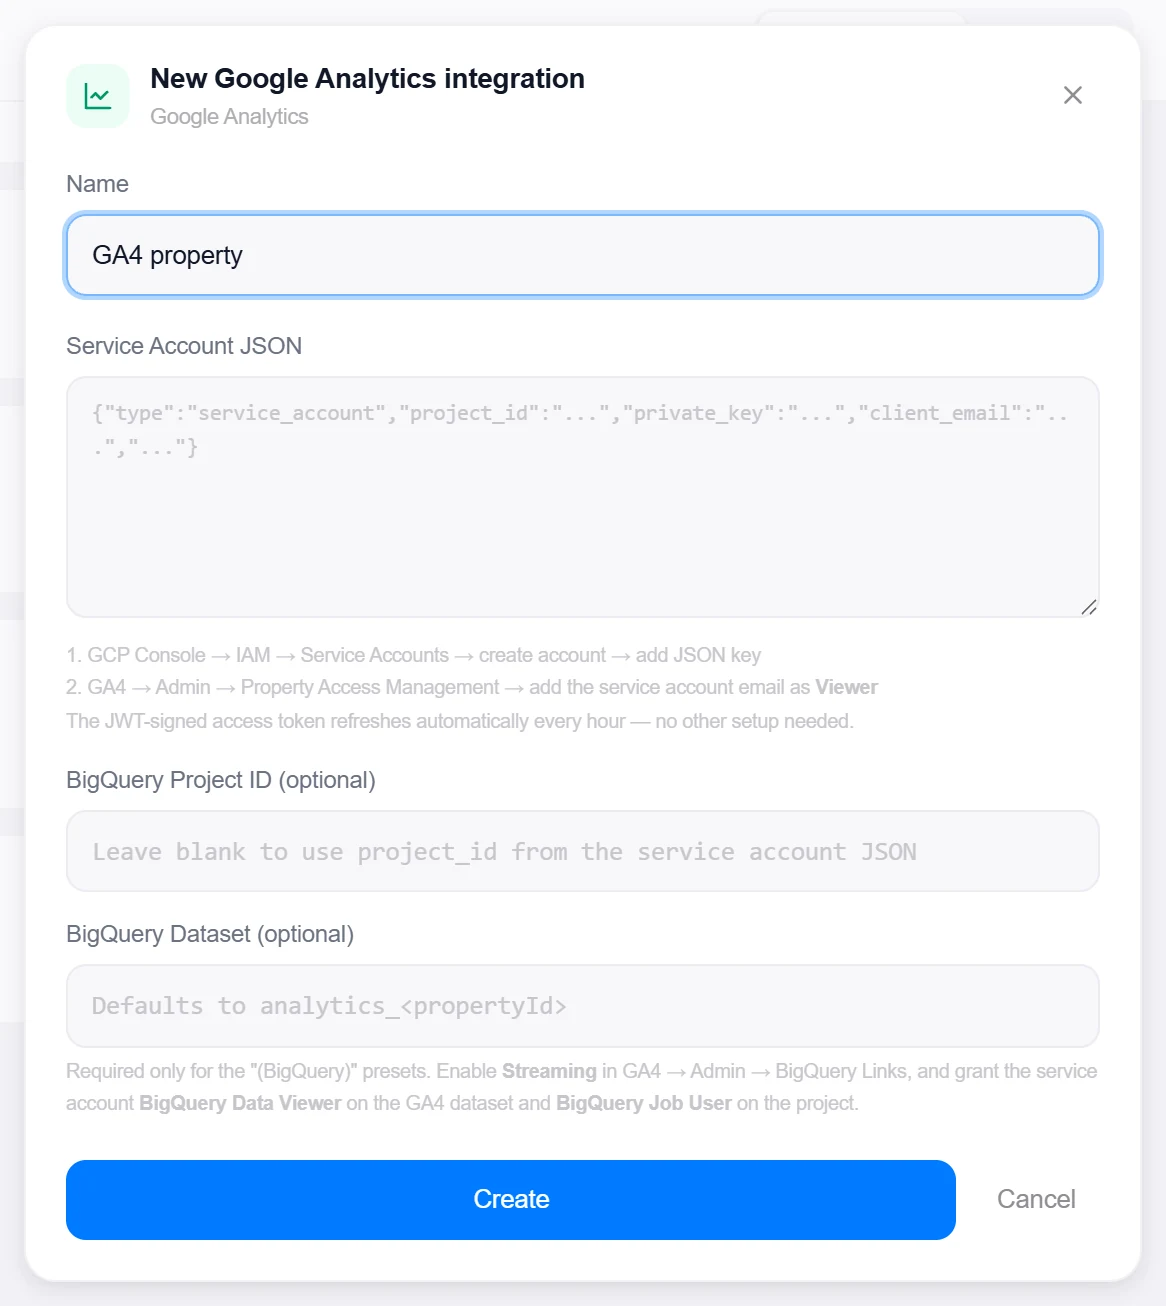
- Paste the JSONDrop the whole key file into Service Account JSON — the drawer echoes the detected
client_email. The optional BigQuery Project ID and BigQuery Dataset fields default to the JSON’sproject_idandanalytics_<propertyId>. - Create, then verifyClick Create, then reopen the integration and click Test — it lists account summaries and reports how many GA4 properties are accessible; with a BigQuery project set it also runs a trivial
SELECT 1to validate the Job User role and appends “BigQuery OK”.

Target on a private network? Route it through a proxy agent. Proxy agents run inside your network — behind NAT, on a management VLAN, in an air-gapped segment — and reach targets the Topologix server can't. The agent polls the server every 15 seconds for its assignments, runs the checks locally, and pushes results back every 5 seconds, so no inbound firewall rules are ever needed. Set a default proxy on the integration; every metric source can override it. If a proxy goes offline, its sources are marked stale within ~90 seconds and the last known values stay visible.
2 · Add it to a flow
- Select the nodeClick the node, open Metrics, then + Add and choose the Google Analytics integration.
- Pick property and metricThe GA4 Property dropdown is discovered from the service account (it’s the numeric Property ID — not the “G-” Measurement ID), and the Metric list shows every preset tagged with its path:
realtime,report, orbigquery (~1m lag). - SaveOptionally set a label, pick the interval, and click Add Source.
Live canvas screenshots for this integration require a real Google Analytics environment, so this guide shows the configuration screens only — the flow steps above work exactly like every other integration.
Good to know
- Report presets use GA4’s own relative date ranges (
yesterday,7daysAgo,28daysAgo), and the rate presets (engagement, bounce) are converted to percentages for the card. - The BigQuery presets read
events_intraday_*— active users viaAPPROX_COUNT_DISTINCT(user_pseudo_id), events viaCOUNT(*)— so they see activity within about a minute, far ahead of the Data API’s processing lag. - Misconfiguration comes back as the exact fix, not a stack trace: a missing streaming export reads “turn on Streaming in GA4 → Admin → BigQuery Links”, a 403 names the two BigQuery roles to grant.
More Analytics & Apps integrations
See it on your own infrastructure
Book a demo and we will walk you through Topologix with your systems in mind: on our cloud, or self-hosted in your own network.