RECAP in Topologix
Analytics & Apps
Not a metric source — a read-only client of your RECAP deployment (log distillation and root-cause analysis). Attached to an alarm source, it stamps each alarm row with an R badge showing whether RECAP already knows that error, deep-linking into the incident with its blast radius and LLM post-mortem.
Requirements
- A RECAP deployment reachable over HTTP(S) — a bare host is assumed
https— from the Topologix server, or through a proxy agent for the usual LAN-only install. - An API key generated in RECAP → Settings → Integrations. It is stored server-side and never sent to the browser; the UI only ever sees derived data and public permalinks.
1 · Set up the integration
- Open the Integrations pageClick Integrations in the toolbar and pick RECAP from the catalogue.
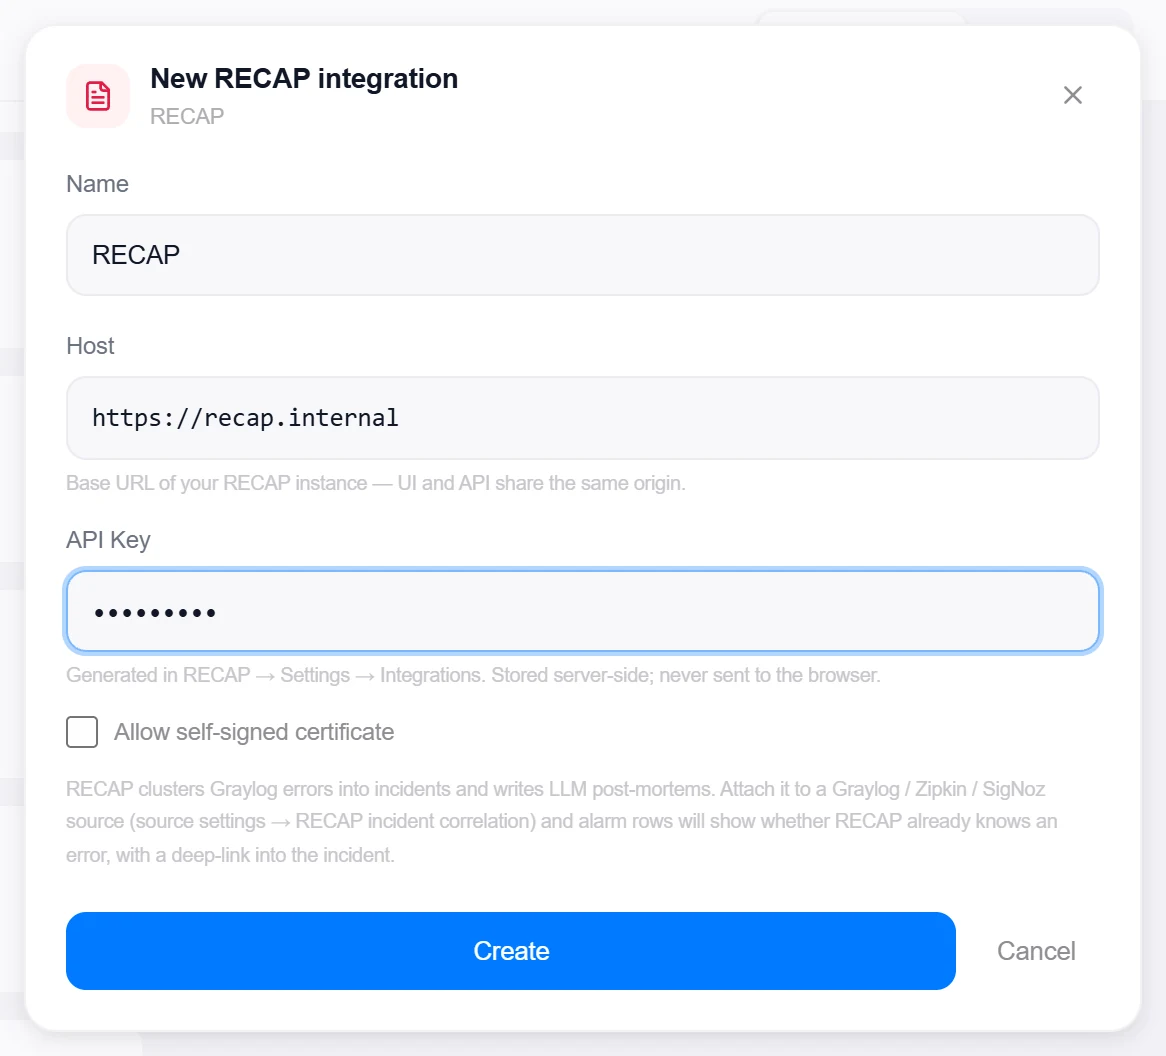
- Enter host and API keyHost is the base URL of the instance (UI and API share the same origin) and API Key the key from RECAP’s settings. An Allow self-signed certificate toggle and an optional Connect via proxy picker cover LAN-only deployments — when set, every RECAP call (incident resolves, RCA previews, connection tests) flows through that proxy.
- Create, then verifyClick Create, then reopen the integration and click Test — it hits RECAP’s unauthenticated health endpoint for reachability and version, then makes a keyed probe to prove the API key is actually accepted, reporting “Connected — RECAP (API key valid)”.

Target on a private network? Route it through a proxy agent. Proxy agents run inside your network — behind NAT, on a management VLAN, in an air-gapped segment — and reach targets the Topologix server can't. The agent polls the server every 15 seconds for its assignments, runs the checks locally, and pushes results back every 5 seconds, so no inbound firewall rules are ever needed. Set a default proxy on the integration; every metric source can override it. If a proxy goes offline, its sources are marked stale within ~90 seconds and the last known values stay visible.
2 · Add it to a flow
- Attach it to an alarm sourceRECAP adds no sources of its own. Open the settings of a Graylog All Services source, a Zipkin source, or an OpenTelemetry (OTLP) all-services alarm and pick your RECAP integration under RECAP incident correlation.
- Read the badgeAlarm rows — and the trace viewer — get a compact R. Outlined gray: not matched to a RECAP incident yet, linking straight into RECAP with the same parameters (it may well resolve by click time). Solid: matched, colored by incident status — red open, amber acknowledged, green resolved.
- Drill into the incidentClick a solid R to open the incident popup: status, occurrence count and class, the blast radius (implicated vs neighbor services with call/error/latency stats and a chronological cross-service log timeline), and — when RECAP ran an RCA on that occurrence — the post-mortem narrative.
Good to know
- Matching is a ladder: exact trace id first, then service + detection time within RECAP’s ±30-minute occurrence window (with a wider fallback for recently-cleared rows). RECAP clusters errors in ~60-second windows, so a badge can appear a beat after the alarm row does.
- Enrichment never breaks the alert view — while a resolve is loading, or when RECAP is unreachable, the badge simply doesn’t render and rows fall back to plain alarms.
- To see the badge in action, see the Graylog guide’s All Services section — its live-alarm screenshot shows a solid R linking a breaching service to an open RECAP incident.
Related guides
See it on your own infrastructure
Book a demo and we will walk you through Topologix with your systems in mind: on our cloud, or self-hosted in your own network.