Zabbix monitoring with Topologix
Monitoring & Observability
Bring Zabbix-monitored hosts onto the canvas — an auto-detected Server vitals card (CPU / RAM / swap / filesystems / disks) or any numeric item from any host with per-item thresholds. Works against Zabbix 5.x, 6.x, and 7.x over the JSON-RPC API.
Requirements
- HTTP(S) reach from the Topologix server or a proxy agent to the Zabbix frontend URL — the same base the web UI uses, including the
/zabbixpath if your install has one. - A Zabbix user with at least read access to the monitored hosts and their items (Zabbix grants permissions per host group) — Topologix signs in via
user.loginand only ever reads. - Self-signed HTTPS is accepted by unticking Verify TLS certificate.
1 · Set up the integration
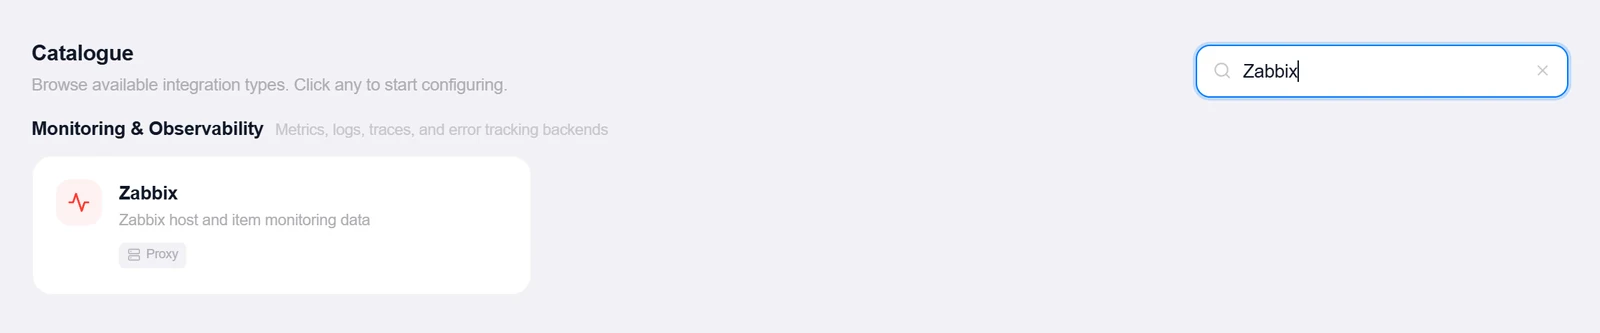
- Open the Integrations pageClick Integrations in the toolbar and pick Zabbix from the catalogue.
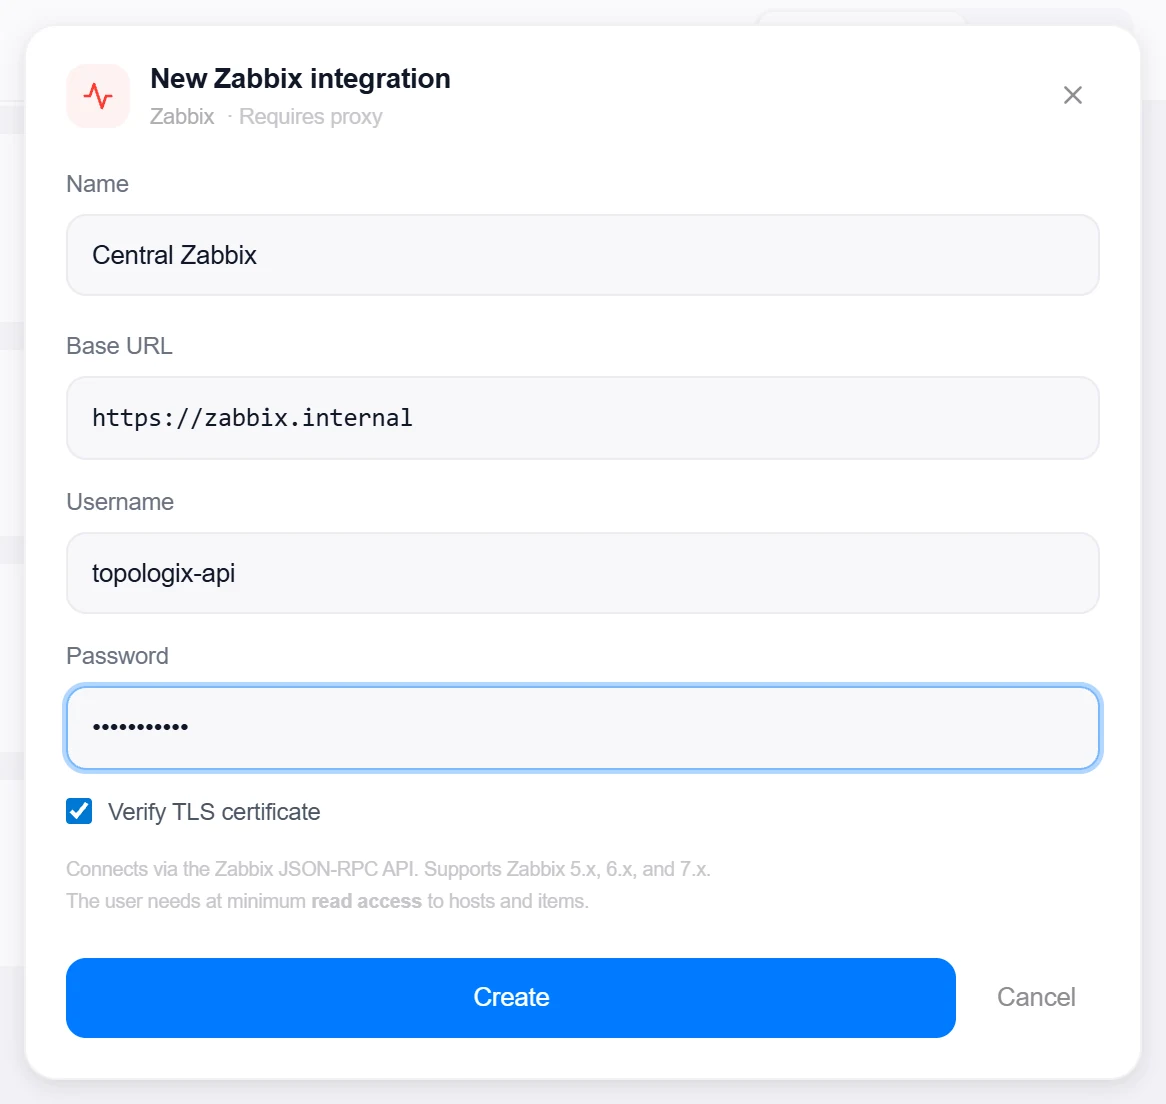
- Enter the base URLE.g.
https://zabbix.example.com/zabbix— Topologix appends/api_jsonrpc.phpinternally, so don’t include it. - Enter the credentialsUsername and Password of the read-only API user. The auth transport is picked automatically per instance version —
Authorization: Beareron 6.4+, bodyauthon older releases. - Create, then verifyClick Create, then reopen the integration and click Test — it calls
apiinfo.versionand performs a real login, reporting “Connected — Zabbix 7.0.0”-style.
2 · Add it to a flow
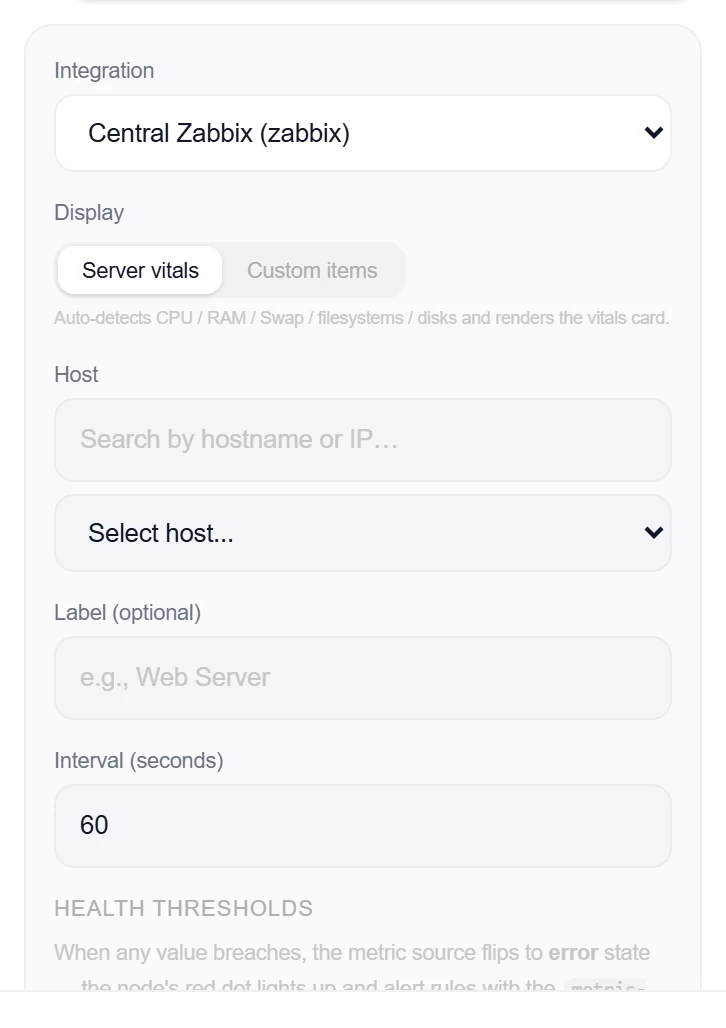
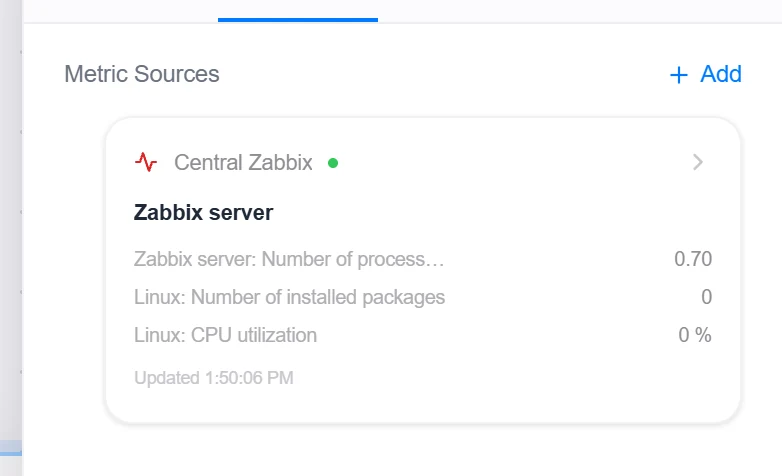
- Select the nodeClick the node, open Metrics, then + Add and choose the Zabbix integration.
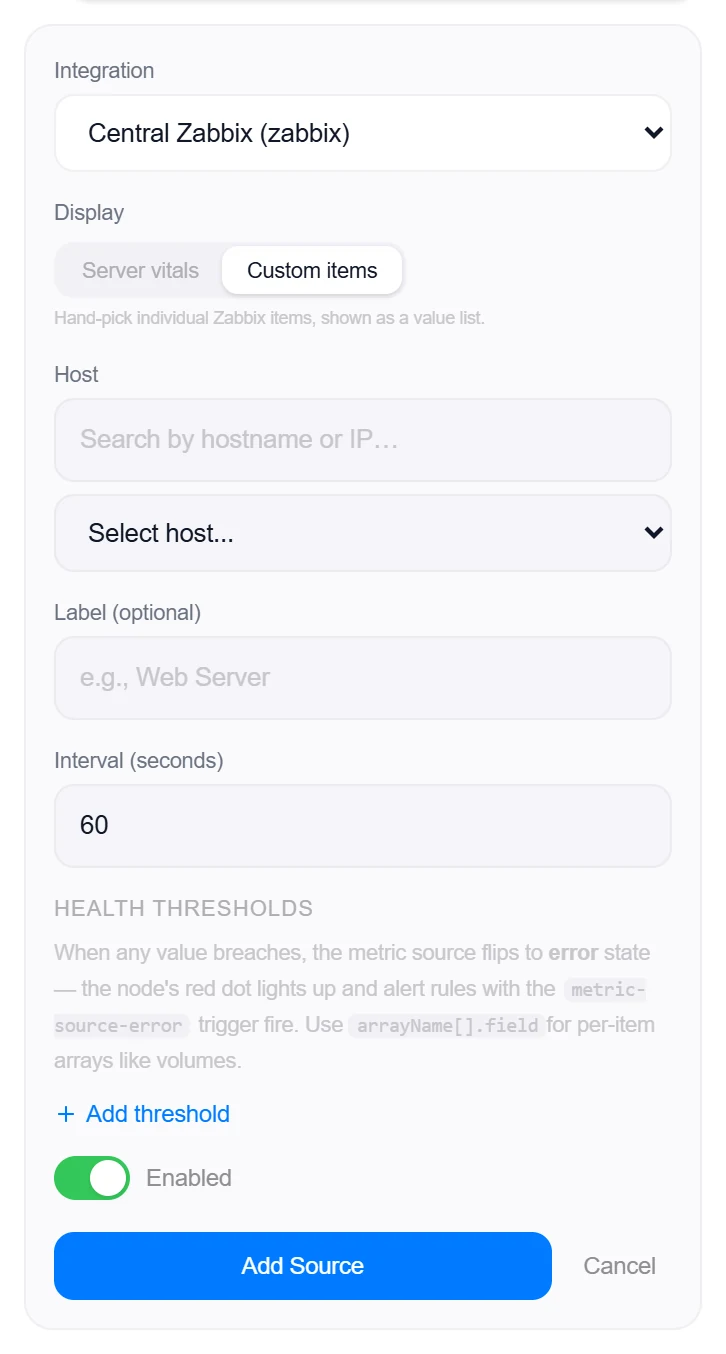
- Pick a host and a display modeThe host dropdown lists every enabled Zabbix host, searchable by hostname or IP. The Display toggle switches between Server vitals (the OS card) and Custom items (a hand-picked value list).
- SaveSet the interval and click Add Source. Vitals failures and per-item threshold breaches turn the node red and drive alert rules.
3 · Beyond presets: custom queries & the All-Services alarm
Server vitals
Auto-detects the standard OS items on the selected host — CPU, RAM, swap, per-mount filesystem usage and per-device disk activity — and renders them as the same vitals card the node_exporter integration draws. The detected selection is editable, with a Re-detect button to start over.
- Hosts without recognizable OS items say so explicitly and point you to Custom items — no silent empty card.
- Free/available readings are flipped into used-% automatically where the template reports them inverted.
Custom items
Hand-pick any numeric items from the host — the picker shows each item’s name, key, live last value and units, with a filter box and an optional per-item Threshold. At create time you can stage several hosts in one pass (“+ Add this host & select another”); each staged host becomes its own source.
- “Duplicate to…” clones a staged host’s metric set onto another similar host, matched by metric key — items missing on the target are skipped and reported.
- Only numeric item types (float / unsigned int) are offered — text, log and character items can’t be charted.
Coverage report
Reopen a saved Zabbix integration and click Coverage for a read-only report of what this Zabbix monitors and what Topologix can use of it — useful before a rollout and as a pre-sales summary (Copy as text puts the whole report on the clipboard). The read takes a few seconds to about two minutes on a large estate; a second click within a minute reuses the last answer.
- Host classes — Linux / Unix servers, Windows servers, ESXi hypervisors, SNMP devices / network, iLO / iDRAC / IPMI, web checks and other, decided from the linked templates, the interface types (agent, SNMP, IPMI, JMX) and the item keys; the template distribution (top 50) is listed too.
- What Topologix can use — a ready / partial / missing checklist: fleet vitals, baselines (trends kept at least 21 days), software inventory (service / systemd / process discovery rules and application templates), the process-to-service map (the Topologix template), logs and crash / OOM events.
- Vitals coverage per OS class — how many hosts report CPU, memory, swap, filesystems, network in / out (and whether in bits/s or bytes), load, uptime, cores and Windows
perf_counteritems. - Already covered elsewhere — the Zabbix hosts that are VMs of your vCenter (by IP and name, IP only or name only), ESXi hosts, hosts with the Topologix host agent or a Server Vitals source, and the rest by class — with up to 10 names each. Only the inventory the integration owner (and their organisation) can see is used.
- Discovery rules, process / service items, log items (the watched file and event log names only — no log line is read), retention (the housekeeping overrides when the API user may read them, otherwise the history / trends values of the vitals items) and agent kinds and versions.
- Through a proxy the report needs proxy 1.266.0 or later; only the aggregated report leaves the proxy (never an item list), scrubbed by your redaction rules first.
Fleet vitals
Switch on Fleet vitals on a saved Zabbix integration (off by default) and Topologix reads the current vitals of the Zabbix hosts it does not already cover — without adding a single item to Zabbix. Every hour it discovers the hosts and their vitals items (one item.get per 100 hosts); every five minutes it reads the latest values (one item.get per 2000 items) and keeps one row per host, replaced in place. The integration shows what is tracked: hosts by kind and class, the last pass and its errors.
- What each host gets (the Coverage report’s overlap, in this order): a host with the Topologix host agent or a Server Vitals source, and an ESXi host, are skipped — they are read there already; a vCenter VM gets the fields vCenter cannot see from outside: filesystems, swap and load; a server outside vCenter gets the full set — CPU, memory, swap, load 1 / 5 / 15, network in / out (summed over the real interfaces, bits/s converted to bytes/s), filesystems per mount, disk latency and IOPS, uptime and cores. iLO / iDRAC / IPMI, web checks and network devices are never read.
- Keys: the stock “Linux by Zabbix agent” and “Windows by Zabbix agent” items (
system.cpu.util,vm.memory.utilization/vm.memory.util,system.swap.size,system.cpu.load[all,avg1|5|15],net.if.in|out,vfs.fs.size/vfs.fs.dependent.size,vfs.dev.*,system.uptime,system.cpu.num) and the Windowsperf_counter_envariants (paging file usage, PhysicalDisk latency / IOPS). Loopback and container interfaces are left out of the network sum; a raw byte counter without a per-second rate is not summed. - Where it shows: the monitoring bot’s
host_vitalsanswers “how full is the disk on X / is Y swapping” from it (with the sample’s age), and the VM detail dialog shows Inside the guest (Zabbix). - Network devices (server 1.427.0): the Zabbix hosts classified as network gear (SNMP switches, routers, firewalls) get their own small selection — CPU (
system.cpu.util[*], averaged), memory (vm.memory.util[*], the fullest pool), uptime (system.net.uptime/system.hw.uptime), interface status (net.if.status[*]→ ports up / total, up to 128 interfaces, read every third pass and only for network hosts), reachability (icmpping, loss, response time) and the identity textsystem.descr/system.objectid/system.hw.model/system.sw.os(≤ 256 characters) — plus their host groups. They are listed on Infrastructure → Network as “Source: Zabbix”, merged into a device your flows already poll when the address or name matches; never trended. Needs proxy 1.279.0 or later on a proxy-read integration (an older proxy lists the hosts without these values). - Cost: about a dozen database statements and well under a second per five-minute pass on the Topologix side; the interval is Admin → System → Background workers → Zabbix fleet vitals: interval (60–3600 s). Through a proxy it needs proxy 1.267.0 or later — an older proxy is never sent the request, and the integration says so.
Baselines (now vs usual)
With Fleet vitals on, Topologix also keeps a 12-week hourly history of each tracked host’s vitals from Zabbix’s own trends (trend.get — hourly average and maximum, nothing added to Zabbix) and folds it into a weekday × hour profile: for “Saturday 14:00” the median and the p10–p90 band of the Saturday-14:00 hours of the previous weeks. Then a value is judged against its own hour of the week — 80% CPU during the Monday batch is usual, the same 80% on a Sunday night is not.
- What gets a baseline: the numeric vitals only — CPU, memory, swap, load 1 / 5 / 15, the fullest filesystem and network in / out (summed, bytes/s); a vCenter VM only its in-guest fields (swap, load, the fullest filesystem). Never per mount or interface, uptime or cores.
- When: every night at Admin → System → Background workers → Zabbix fleet baselines: nightly hour (organisation time zone, default 03:00) every tracked host reads the hours Zabbix has recorded since its stored history ends (about a day, plus a 2-hour overlap; a host that missed nights catches up automatically, up to 12 weeks), and a host without a baseline reads 12 weeks; a host whose history did not change is not rewritten. Zabbix fleet baselines: hosts per night (default 1 = every host every night) can spread the reads instead: N = each host every N days (7 = the weekly rotation used before server 1.485). The Servers page Vitals charts also read the newest hours since the stored history live from Zabbix (cached for 10 minutes, never stored). Backfill now under the Fleet vitals switch (integration owner or admin) reads 12 weeks for every host over the next hours instead — at most 20 hosts per request, one request at a time, 60 hosts an hour.
- Usual needs the same minimum weeks as the other seasonal baselines (Admin → System → Background workers → Baseline minimum weeks, default 3); before that a value says “learning”. The verdict is the one every seasonal check uses: unusual = at least twice the usual median, above its p90 and well outside its spread (network also when it drops that far below).
- Where it shows: the bot’s
host_vitalsadds “usual for Sat 14:00: … (p10 … – p90 …) → now … [usual] / [UNUSUAL]” per value, and Inside the guest (Zabbix) shows “usual … for Sat 14:00” next to load, swap and the fullest filesystem. No alerts are raised from it. - Cost and size: one row per host and vital (≈ 22 KB of history + ≈ 10 KB of profile), a few database statements per 20 hosts; Zabbix gets at most 20 000 trend rows per call. Through a proxy it needs proxy 1.269.0 or later — an older proxy is never sent the request, and the panel says so.
Process map
With Fleet vitals on and the Topologix process map template linked to a host, Topologix turns what the host listens on into services on the map. Every 10 minutes it reads the template’s listen.json and conns.json (in the same Zabbix call as the vitals, at most 250 hosts a pass) and names each listening process: its systemd unit (postgresql@14-main.service → postgresql), its Windows service name, or else its executable — a generic runtime without a unit is named by its lowest port (java-8080). The same name on several hosts is one service placed on each of them.
- What appears: on Infrastructure → Topology each service sits on its vCenter VM (the VM Zabbix and vCenter agree on) or on a server node for a Zabbix host outside vCenter, with the badge Discovered from Zabbix. Impact analysis and change blast radius see them like any other service — a change on the VM reaches the services on it and their callers. If a service of the same name already exists (from traces, Kubernetes, a data source or the host agent) the placement attaches to it; it is never renamed.
- Promote to catalogue: a discovered service is on the map but not in the Catalogue and does not count toward your licence. Open its card and click Promote to catalogue (the integration’s owner): it becomes a catalogue service of that Zabbix integration and counts toward the licence’s services from then on — the confirmation says so.
- What is left out: infrastructure processes (sshd, chrony, cron, the Zabbix agent, cloud / VMware agents, the Windows RPC / WinRM / SMB / System listeners and the rest of the collector’s list), loopback-only listeners and ports in the ephemeral range (32768 and up) unless that is the service’s only port. A listener inside a container network namespace is kept and flagged. Windows
http.syssites (IIS) listen as the System process and are not named. - Caps and timing: a service appears after two consecutive samples and leaves after three samples without it (a quiet host gives one sample an hour, so a stopped service leaves within about two hours; a host whose collector has not reported for a day loses its services within half an hour). At most 300 services per Zabbix integration — the busiest (the most other hosts connecting to it) are kept; the integration shows “N services discovered on M hosts (template on K hosts)” under the Fleet vitals switch.
- Network flows: with NetFlow / IPFIX, a flow to a VM or server port resolves to the service listening on that port (the process listening on the port), even when several services share the machine; the calling side is named by the process whose
conns.jsonreaches that address and port (the calling process). Withoutconns.jsondata the client stays the VM. Traffic between two services on the same host never crosses an exporter — it needs the vDS IPFIX export to be seen at all. - Through a proxy the texts are scrubbed by your redaction rules under the kind
zabbix-fleet-texts(scope diagnostics since proxy 1.268.0: the built-in secret rules and your “all” / “diagnostics” rules apply, so process and unit names stay readable). Proxy 1.267.0 works too (every rule applies).
Software inventory
With Fleet vitals on, Topologix also reads what software runs on each tracked host (a vCenter VM or a server Zabbix covers) once a day — from what Zabbix already knows, nothing installed: the linked templates (“Apache Tomcat by JMX” → Apache Tomcat, “Generic Java JMX” → Java (JMX), IIS, MSSQL, PostgreSQL, MySQL / MariaDB, Oracle, Nginx, Apache, Redis, RabbitMQ, Kafka, Elasticsearch, Docker, Windows / Linux by Zabbix agent …), a JMX interface and its port, the host inventory’s OS / software fields when filled in, and the names of the Windows services, systemd units and processes its items watch (service.info from the Windows services discovery, systemd.unit.*, proc.num, and agent 2’s proc.get).
- Only names leave Zabbix: template, service, unit and process names, a service’s state and the JMX port. From
proc.getonly each process’s name and how many there are are kept — the command line, user, environment and every other field are dropped before anything is sent. Through a proxy the result is scrubbed by your redaction rules under the kindzabbix-fleet-inventory(scope all — every rule applies). - Products: each host gets a short list of products, each with where it was found (template, JMX, service, unit, process, inventory) and a runtime hint (Java, .NET, Node.js, Python, native …). Templates Topologix does not recognise are kept by name.
- Where it shows: a Software row in Inside the guest (Zabbix) on the VM, “Software: N hosts read — Java (JMX) 40 · IIS 12 …” under the Fleet vitals switch, and the bot’s
host_vitalsanswer (up to 20 products). A discovered service on the Topology shows its runtime when the name gives it away (tomcat9 → Java, java-8080 → Java, w3svc → .NET). - Services without the process map template: on a host where the Topologix process map template is not linked, its running Windows services and active systemd units become discovered services on that VM / server too — named, without ports (so a network flow still resolves to the VM, not to one of them). The operating system’s own services and the infrastructure agents are left out; they follow the same rules as the process map (two daily reads to appear, three without to leave, “Promote to catalogue”) and share its 300 services per integration. Linking the template later replaces them with the port-aware services.
- Cost: one Zabbix read per 250 hosts a day (at most 200 names per list and 64 KB per host), one database row per host. Through a proxy it needs proxy 1.270.0 or later — an older proxy is never sent the request, and the panel says so.
Logs and crash events
With Fleet vitals on, the hourly item discovery also notes each host’s log items — log[…], logrt[…] and eventlog[…] (up to 20 a host; the *.count items are numbers, not logs). Only the watched file path or event log name is kept, never the item’s filter. Three things use them.
- The monitoring bot (
search_logs, sourcezabbix): name a host — its Zabbix name, an IP or the VM’s name — and the bot reads that host’s log items over the asked window (absolute, up to 24 h a call, up to 1000 lines) in one read through the integration’s own proxy. Zabbix’s history API has no text search, so a text filter is applied after the read and the answer says so (“filtered 12 of 640 lines”). A line’s level comes from the Windows event severity, or a level word in the line (ERROR,level=warn,[error]…); an OOM kill, segfault or faulting application counts as an error. Forensics lists the same source as “Zabbix logs” on a VM, server or IP. - Errors per host (log items): add a Zabbix data source and choose this display. Every check counts the error lines of every log item per host and file (the service is
<host>:<file or event log>), learns a baseline per host and flags new error types from the newest error lines, like the other log sources. A quiet log item counts as a measured zero; one Zabbix could not read is left out, never a zero. Off unless you add the source. - Crash events: the process-map template’s
crash.json(OOM kills, segfaults, core dumps, failed units, Windows faulting applications and unexpected shutdowns) is read every 10 minutes with the process map, and the hosts’ system log items (/var/log/messages,syslog,kern.log, the Windows System / Application event logs) are scanned for the same events. Each becomes a kernel episode on the VM or server — the same crash seen in both places is one episode — naming the discovered service whose process crashed when the process map placed it there. They show in the kernel-episode lists, Forensics, the bot’ssearch_eventsand the evidence pack; no alert fires from them yet. - What counts as a crash (server 1.417.0): a segfault, a core dump, a Windows faulting application or .NET crash, and a Windows service that terminated with no recovery (event 7034) are class crash; an OOM kill is oom. An unexpected shutdown (Windows 6008) is a reboot, not a crash. A service that terminated and that Windows restarts by itself (7031) is informational — never an episode; the integration’s fleet status counts these restarts. A Linux unit in the failed state is a crash only when it is a long-running unit (not
Type=oneshot, not started by a timer) that carries a service the process map placed on the host — a failed batch job or a unit nothing runs on is ignored (collector 1.2.0 skips oneshot and timer units at the source; the server applies the placement rule to older collectors too). Repeated failures of the same process or unit within one hour are one episode with a count and the time of the last one. - Redaction and versions: through a proxy the lines are scrubbed by your rules under the kinds
zabbix-log-historyandzabbix-log-samples(scope logs). It needs proxy 1.271.0 or later — an older proxy is never sent the read (the bot says “update the proxy” without spending a live slot, and the crash scan is skipped whilecrash.jsonstill works).
Topologix process map template
Reopen a saved Zabbix integration and click Download Topologix template for a zip with the Zabbix template “Topologix process map” and a small collector for Linux and Windows. Every 5 minutes the collector writes three JSON files — which process listens on which port (listen.json), which process connects to which peer ip:port (conns.json, top 500) and OOM kills, segfaults, core dumps and failed units / faulting applications of the last 24 hours (crash.json) — and the Zabbix agent reads them with vfs.file.contents. Topologix turns them into a process-to-service map. No sudo rule, no new port, works with Zabbix agent and agent 2.
- Install the collector on each hostLinux (systemd, Python 3.6+):
sudo sh install-linux.sh— a root systemd timer every 5 minutes, writing to/var/lib/topologix. Windows (PowerShell 5.1+):install-windows.ps1from an elevated PowerShell — a Scheduled Task as SYSTEM, writing toC:\ProgramData\Topologix. Both take--uninstall/-Uninstall. - Import the template onceIn Zabbix, Data collection → Templates → Import, choose
topologix_process_map.yaml(Zabbix 7.0+) ortopologix_process_map_zabbix6.4.yaml(6.4). It lands in Templates/Applications. - Link it to the hostsLink “Topologix process map” to the hosts that run the collector — one by one or by mass update for a host group. On Windows hosts set the macro
{$TOPOLOGIX.DIR}toC:\ProgramData\Topologix. - VerifyFrom the Zabbix server or proxy:
zabbix_get -s <host> -k 'vfs.file.contents[/var/lib/topologix/listen.json]'; then Coverage here counts the hosts with the template in its “Process → service map” row.
- Never collected: command lines, environment variables, process memory, file contents or the names of open files — a process is named by its executable’s file name and its systemd unit / Windows service only; crash details are one short reason (at most 200 characters).
- Why root / SYSTEM: mapping a socket to its process needs other users’ descriptor lists, and the kernel log is root-only. The Linux service is sandboxed (read-only file system except
/var/lib/topologix,NoNewPrivileges, two capabilities, Unix sockets only, low CPU / IO priority, 64 MB memory cap); the Zabbix agent itself stays unprivileged and only reads the world-readable result files. - Items: three passive agent text items every 10 minutes (history 1 day, no trends) with Discard unchanged with heartbeat 1 h — the collector writes no timestamp into
listen.json/conns.json/crash.jsonand rounds connection counts to powers of two, so a quiet host stores about one value an hour instead of six; a tinystatus.jsonitem carries the run time and feeds the dependent “collector data age” item and the trigger Topologix collector stale (Warning, after{$TOPOLOGIX.STALE}= 30 minutes). Each file stays under 60 KB (Zabbix text items hold 64 KB); anything bigger keeps its top entries and says"truncated": true. - SELinux: if the agent cannot read the files on an enforcing RHEL-family host, check
ausearch -m avc -c zabbix_agentdand label the directory (for examplezabbix_var_lib_t) — the README in the zip has the commands.
Good to know
- Items with no data yet read as “—”, never a misleading 0, and the session token is cached for an hour with an automatic single re-login when Zabbix terminates the session server-side.
- The same integration doubles as the OS-vitals enrichment provider on database sources (Postgres, MySQL, MSSQL…) — the DB host is auto-matched against the Zabbix host list and the DB card gains the vitals panel.
More Monitoring & Observability integrations
See it on your own infrastructure
Book a demo and we will walk you through Topologix with your systems in mind: on our cloud, or self-hosted in your own network.