Dynatrace monitoring with Topologix
Monitoring & Observability
The Dynatrace federation bridge — service APM metrics, the open-problems feed and Smartscape service-flow topology on your own canvas, with 4 service presets, any custom metric selector, and an all-services latency alarm. An optional Grail token adds span-level trace waterfalls.
Requirements
- Your environment URL — SaaS:
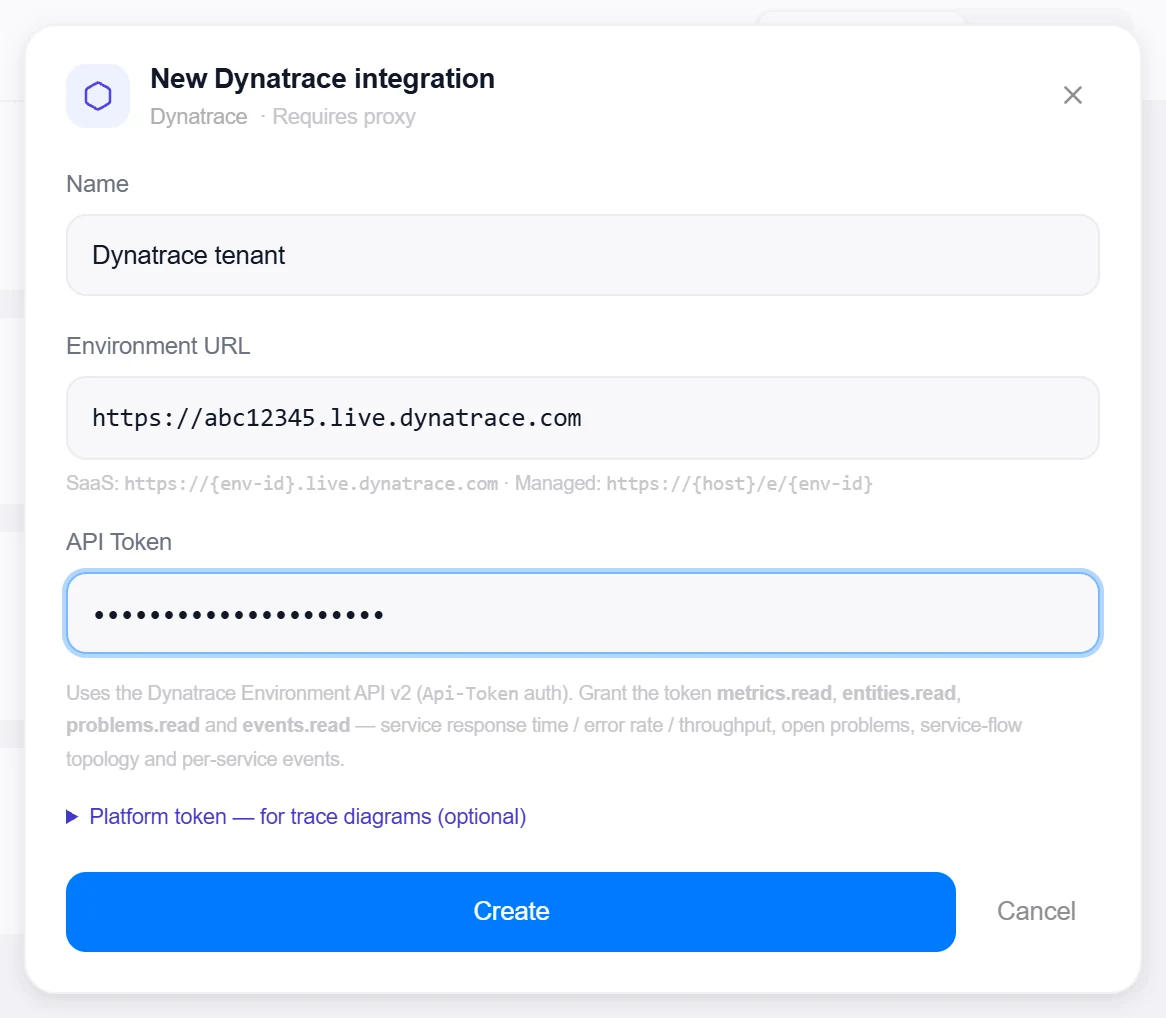
https://{env-id}.live.dynatrace.com· Managed:https://{host}/e/{env-id}. - An API token (
dt0c01.…) with the metrics.read, entities.read, problems.read and events.read scopes — Topologix talks to the Environment API v2 withApi-Tokenauth. - Optional: a platform token (
dt0s16.…) withstorage:spans:read+storage:buckets:readfor Grail DQL span traces — the Api-Token can’t read spans. Leave it empty and everything works except the per-service “view traces” button.
1 · Set up the integration
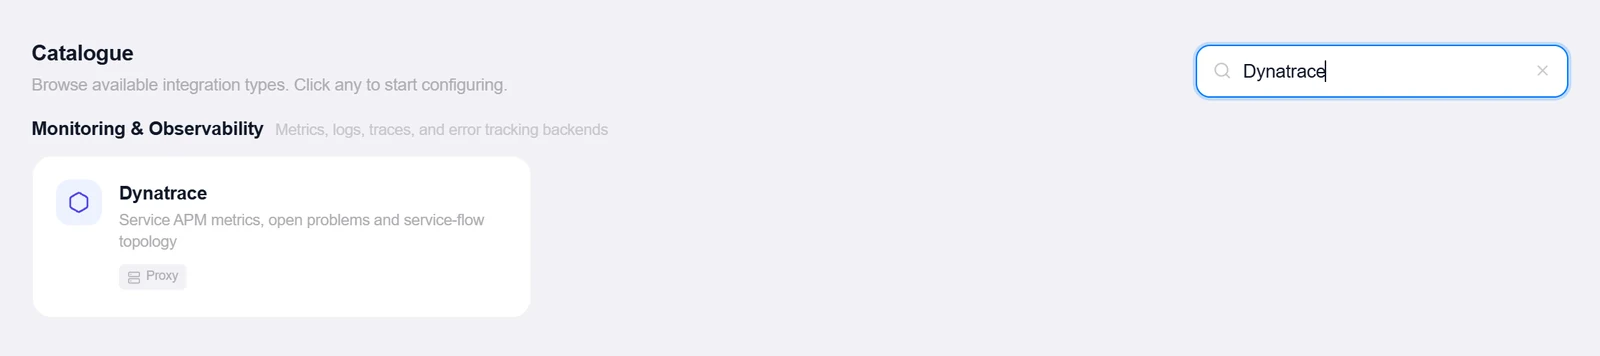
- Open the Integrations pageClick Integrations in the toolbar and pick Dynatrace from the catalogue.
- Enter the Environment URLThe tenant root —
https://abc12345.live.dynatrace.com, or the/e/{env-id}form for Managed. - Paste the API TokenAnd, if you want trace waterfalls, expand Platform token — for trace diagrams and paste the Grail token there.
- Create, then verifyClick Create, then reopen the integration and click Test — it lists SERVICE entities and reports “Connected — 181 service(s) visible”.
2 · Add it to a flow
- Select the service nodeClick the node, open Metrics, then + Add and choose the Dynatrace integration.
- Pick one of the four modesThe 2×2 mode grid: Service metric — a discovered service plus one of 4 presets (Avg Response Time (ms), P90 Response Time (ms), Error Rate %, Requests); All-services alarm — every service whose average response time crosses your ms threshold fires its own breach row, no service selection; Open problems — counts OPEN problems with an optional severity filter (Availability, Error, Performance, Resource, Custom alert, Monitoring unavailable), any open problem warns amber and the optional count cap escalates to red; Custom metric — any Dynatrace metric selector, scoped to the chosen service.
- Scope and saveSet the lookback window (not used by problems mode), an alarm threshold or problem count cap, a label and the interval, then click Add Source.
4 · Instrument services & track queries
Instrument your services
Two ways in. OneAgent on the host or in the container instruments Java, .NET, Node.js, Go, PHP and Python automatically — services, their calls and their database statements show up in Smartscape with nothing changed in the code. Services you instrument with OpenTelemetry send OTLP straight to the environment’s ingest endpoint instead; both end up as SERVICE entities that this integration lists and that Discover from Traces walks.
- OneAgentDeploy → Dynatrace Hub → OneAgent for the platform (installer, Docker image, or the Dynatrace Operator on Kubernetes). Service names come from the process group / web application detection; use Settings → Service detection or the
DT_CUSTOM_PROPvariable to override. - OpenTelemetry → DynatraceCreate an API token with the openTelemetryTrace.ingest scope (add metrics.ingest / logs.ingest for the other signals) and point the exporter at
https://<env-id>.live.dynatrace.com/api/v2/otlp. The token travels in theAuthorization: Api-Token …header — inOTEL_EXPORTER_OTLP_HEADERSthe space must be URL-encoded. - Confirm it workedServices → the new service, then in Topologix reopen the integration → Test (“Connected — N service(s) visible”) and run Import → Discover from Traces.
OpenTelemetry SDK or agent → Dynatrace OTLP ingest
OTEL_SERVICE_NAME=checkout-api
OTEL_EXPORTER_OTLP_ENDPOINT=https://abc12345.live.dynatrace.com/api/v2/otlp
OTEL_EXPORTER_OTLP_PROTOCOL=http/protobuf
OTEL_EXPORTER_OTLP_HEADERS=Authorization=Api-Token%20dt0c01.<token>
Query tracking
With a platform token (storage:spans:read + storage:buckets:read) on the integration, Topologix pulls trace waterfalls from Grail and reads the database fields on each span — db.statement / db.query.text, db.system, db.name, server.address — normalising the statement (literals become ?) and fingerprinting it exactly as for OTLP and Zipkin. OneAgent captures SQL for JDBC, ADO.NET, Node.js and Go drivers on its own; OpenTelemetry services need the driver instrumentation described under “Capture SQL on database spans” in the OpenTelemetry guide.
- Add the platform tokenReopen the integration → Platform token — for trace diagrams. Without it the service metrics, problems and Smartscape topology work, but trace waterfalls and their database spans do not.
- Enable statistics on the databasePostgreSQL
pg_stat_statements, SQL Server Query Store or the HANA plan cache — commands in each database guide — and add that database as an integration. - Link and verifyOn the Dynatrace metric source set Database for statement stats to that integration; open a trace, expand a database span, and DB stats returns the statement’s calls, total and mean time.
- Dynatrace’s own database view (Services → database service) keeps the raw statements Dynatrace captured; Topologix only ever stores the normalised form.
Dependencies and blast radius
Every trace backend you connect also feeds one persisted call graph: which service calls which, how often, with how many errors. The Topology tab draws a service's callers and callees at +1 or +2 hops, the Catalogue shows “Calls →” / “Called by ←” on each service, and Blast radius… (on services, externals, VMs, hosts, datastores, devices, databases and business processes) lists everything a change or a maintenance there might touch.
What is collected, and from where
A background dependency sweep reads the service-to-service graph that Discover from Traces already computes, from every enabled Zipkin, OpenTelemetry (OTLP ingest), Dynatrace, Elastic APM and SigNoz integration — through the integration's proxy agent when it has one — and stores one edge per caller → callee pair per owner: calls, errors, a p95 only when a backend measured one, and which integrations reported it. A count nobody measured stays empty, never 0 (Dynatrace's Smartscape edges carry no per-edge counts, so they read “—”). A call to something that is not an instrumented service becomes an external node — an API host, an unmatched database, a queue — unless it matches a monitored database instance, in which case it folds into that instance's node. Externals never enter a runs-on chain. Up to 5,000 edges are kept per owner (the busiest).
Which instance a database call folds into
A database span is matched by its host first (one monitored instance of that engine on the host), then by its db.name — names compare ignoring case and punctuation (crocobetCasinoCommerce, crocobetcasinocommerce and crocobet_casino_commerce are one name; a suffix such as _prod is never stripped). A database held by a primary and its replicas is not ambiguous: the call folds into the primary, both by name and when several instances share the host — a replica is one a primary's replication block names, or a monitored source whose own sample reports it replicates (linked to its primary by that upstream, else by sharing its integration and engine). The external node an earlier sweep drew for that name is then marked stale, its edges with it, as an alias would. Two unrelated instances holding the same name, or a span of another engine, are never guessed: the call stays an external node, and the Catalogue's “database known only by name” gap names the other instance (ambiguous: also on …).
Cadence
Admin → System → Background workers: Dependency sweep interval (default 900 s — 15 min), Dependency lookback (default 3600 s; OTLP ingest ignores it and uses its own in-memory window) and Dependency stale window (default 7 days). The same block shows the sweep's last run — when it started, how long it took, how many integrations it read, each one that failed by name with its error, the edges stored / written / stale — when the next run is due, and a Run now button. The Topology's Calls button starts a sweep too; its tooltip says when the last one ran and how many of your trace sources failed in it. An integration whose sealed credentials cannot be opened is skipped (its stored edges are kept), never read without its secret.
Aliases — when a trace name is really something else
Backends name things their own way: a renamed deployment, an ingress host, a database seen only from its callers. Two ways to say what a name really is — both need edit rights on the integrations' owner (an admin, or the owner); everyone else sees the aliases read-only.
- Catalogue → a service group → Link a trace name…: pick a name from the call graph that is really this service. The group then lists it under Also known as, with × to remove it.
- Topology → an external node → This is actually…: pick the monitored service or database instance (engine and host shown) it really is.
- Aliases are applied first, on every sweep, to every edge — not only new ones. After you save one, a sweep starts; its edges fold into the target and the old edges and the external node are marked stale at once (never deleted). Remove the alias and the next sweep brings the original edges back.
Blast radius — both directions
For a service (or an external or a business process) the blast radius goes both ways across the call graph at 1 or 2 hops: Depends on me (its callers — what breaks if it changes) and I depend on (its callees — what it needs), then down to the pods, K8s nodes, VMs, hosts, datastores and devices they run on, and the business processes any of them belongs to. For a VM, host, datastore, device, database or schema the default is callers only: the services running there and whoever calls them — what a maintenance window touches. Every item carries its path and the reason it is listed, and a confidence: 100 for a call seen by two or more backends, 90 for one, 50 for a stale edge (stale edges are left out unless you tick include stale). Results are capped at 500 services and 500 hardware items, and say so when they are. Export CSV and Open as business process are on the panel.
Stale rules
Nothing here is deleted automatically. A call edge no backend has reported for the stale window is flagged stale — drawn dimmed, lower confidence, kept with its last numbers — and comes back to life the moment a trace shows it again. Removing an integration drops its share of each edge; an edge only it reported stays, as history. An external that no live edge points at any more (an alias folded it into a service, or all its edges aged out) is flagged stale the same way.
Where OTLP- and Dynatrace-only services run
A service seen only through OpenTelemetry or Dynatrace still gets its own node, and its runs-on placement: for OTLP, from the host.ip, host.name, k8s.pod.name and k8s.node.name resource attributes your SDK or collector sends (only those four are kept); for Dynatrace, from the hosts its process groups run on. Each is matched to your pods, K8s nodes and VMs by IP first, then by name, by the same background probe that places Zipkin, Prometheus, Graylog, Elastic APM and SigNoz services (Probe batch size / Probe interval). A placement that has not changed is not rewritten.
The Catalogue — every service in one place
Infrastructure → Catalogue binds everything known about a service together: the integrations that report it (metrics, logs, traces), where it runs, who it calls and who calls it, the databases it uses, its owner and its health. The trace backends are where most services first appear, so this guide carries it; the same page lists every service your other integrations report too.
The list and the service page
The list shows one card per service — names are grouped case-insensitively, so “Checkout” and “checkout” are one card — with its data classes, a health dot, the tier chip and owner, whether it is placed on infrastructure and whether it has live calls. Group by service or by integration; a card loads its detail only when you expand it. The service name (or Open) opens the service page, which has its own link: ?view=catalogue&service=svc:<name> (Copy link in its header). Its sections:
- Identity — every source per integration and data class, with gap chips (“no logs”, “no traces”) and the trace names aliased into it.
- Ownership and Health — below; health with three sparklines (average latency, p95 latency, errors) from the learned baselines, and inbound requests from trace edges (“trace edges, last sweep”). A series nobody measured says “not measured”, never 0.
- Interfaces — the routes it is called on, who calls each one, and what it calls (below).
- Runs on, Calls / Called by, Databases used (the instances it calls, with their catalogued databases), Business processes it belongs to (those you can open), Findings on its VMs, hosts and datastores, Recent vCenter events (last 7 days), Cost share (loaded when opened).
- Change timeline and What changed this week — below.
- The header: favourite star, Blast radius…, Open in Topology, Export ▾. Open in Catalogue reaches the same page from Hypervisors VM rows, the Databases page, the Topology popover, the Business Process editor and blast-radius rows.
Interfaces — what it is called on and what it calls
The service page's Interfaces section is built from traces, not configuration: every inbound route (method + templated path — /wallet/3f2504e0-…/withdraw becomes /wallet/{uuid}/withdraw; also {hex}, {id}, {token}; a path the framework already templated, like /api/{session}/balance, is kept) with its calls, error share, p95, status-code mix and callers (the service whose span called it; a request with no parent span is shown as external ingress), and every outbound peer — another service, a database (its operations keyed on the normalised statement's fingerprint, the same key the database's own statistics use), an HTTP host or a queue — with its top operations. Both instrumentation dialects are read: OpenTelemetry semantic conventions and Spring Micrometer's method / uri / status / outcome / exception tags.
- Sources. OTLP pushes count every span as it arrives. Zipkin is sampled: every 5 minutes the next 25 services (round-robin; Interface inventory: Zipkin services per pass) each get up to 500 traces looking back to their previous visit (5–60 min), so the section says “seen in N traces since …”. A Zipkin reached through a proxy needs proxy ≥ 1.208.0 — with an older one the section says to update it. Dynatrace, Elastic APM and SigNoz do not feed the inventory yet.
- Stored once per flush (Interface inventory: flush interval, default 300 s) in one database transaction; an hourly history is kept 7 days (hourly buckets, on by default). Raw path samples (3 per route) go through your organisation's redaction rules before they are stored; a client's own IP address is never read.
- Health probes — routes matching
/health,/healthz,/livez,/readyz,/liveness,/readiness… (also under/actuator/) — are folded into one line and never enter a change contract. - Not seen recently. A route unseen for 7 days moves to this list (with its last-seen time, calls and callers) and is left out of change contracts; it is deleted 30 days after it was last seen (7 on the built-in SQLite store).
- Bounds. Per service 200 routes and 200 outbound operations (the least recently seen is dropped and counted), 20 callers per route (the rest are counted as “+N”). p95 comes from a sample of 64 durations per route (±2.7 percentage points of rank at 1σ; 32 for outbound, ±3.9) — good for a contract, not an alarm threshold. A value nobody measured shows “—”, never 0.
- The same inventory drives the change page's Contracts card (the routes each caller in a blast radius uses) — see Change management. API:
GET /api/catalog/service/{key}/interfaces?probes=1&stale=1,GET /api/catalog/contract?from=svc:a&to=svc:b(topologix/interface-contract/1).
Ownership
Owner, team, tier (critical / important / standard), environment, description, a runbook link (http or https only) and up to 20 tags. Everyone who sees the service reads it; only the integrations' owner or an admin can change it (the same rule as trace-name aliases) — Edit ownership on the card or the page, and Clear ownership in the editor removes the record. Every change is audited (service_meta.set / service_meta.delete) and shows on the service's change timeline. The tier is shown and sorted on — critical services first in a blast radius, “Affects N critical services” on a Hypervisors finding — but it does not change any alert channel.
Health — what the dot means
A background health fold (Admin → System → Background workers → Service health interval, default 300 s) folds what is already measured into one status per service, with up to 8 reasons. The worst input wins; nothing new is polled. Stale placements and stale call edges never change a status, and a snoozed finding is no breach. A status change is recorded once on the timeline, with a 10-minute flap guard.
| Status | When | Shown as |
|---|---|---|
| Error | a metric source in error · an open critical finding on its VM, host or datastore · a latched breach in error · an inbound trace error rate ≥ 25 % with ≥ 20 calls | red dot; a red ring in the Topology |
| Warning | a source warning · a warning finding · a latched warning · an inbound error rate ≥ 5 % (≥ 20 calls) | amber dot; an amber ring |
| Unusual | only seasonal-unusual sources (outside the learned band, not over a threshold) | violet dot; a violet ring |
| Healthy | at least one measured input, none breached | green dot; no ring |
| Not measured | no source, finding or trace edge reports on it yet (or the fold has not run) | grey dot; no ring — never shown as healthy |
- Where it shows: the card dot (reasons in its tooltip), the Unhealthy first sort and the health facet, the service page header (“Error · since 15m ago”) with every reason, ⌘K hits, and a thin ring on service and database-instance cards in the Topology (reasons in the card popover; the sidebar has a Health legend).
- Health is display only in this version: no alert channel reads it.
⌘K search, facets and saved views
⌘K (Ctrl+K) anywhere opens the command palette: services, database instances, databases and schemas, VMs, ESXi hosts, IP addresses (a VM's guest IPs, a host's management address, K8s node IPs), externals and integrations — up to 50 hits, exact names first, then prefixes, word starts, substrings and typo-tolerant matches. Enter opens the hit; Tab lists its actions (Open, Blast radius of…, Show in Topology, Copy link, Favourite). With an empty query it shows your favourites, team favourites and recent service pages. The index is built per account on demand and refreshed after each catalogue, infrastructure or dependency sweep (at most 1 min old); you only ever find what your integrations can see.
- Facets over the list: kind (service / instance / has databases / has schemas), engine, data class, environment, tier, health and flags (no placement, no owner, stale, no calls). Values inside a facet are OR-ed, facets are AND-ed, and each count is taken over what the other facets keep. The filter lives in the URL (
?f=,&sort=,&group=), so a filtered list can be linked. - Views ▾ saves the search, facets, grouping and order under a name (up to 50 per user), applies, renames and deletes them. Ticking shared lists a view under Team views for everyone in your organisation — read-only for members, editable by its author or an org admin.
Favourites and team sharing
The star on a card, on the service page or on a ⌘K hit favourites a service, instance, database, schema, VM, host, datastore or external (up to 200). The list opens with a Favourites · Team favourites · Recent strip: a favourite marked Share with team appears under Team favourites for everyone in your organisation (only its author or an org admin changes it), and Recent keeps the last 12 service pages you opened.
Gaps — what the map does not know yet
The Gaps (N) badge in the header (or ?view=catalogue&gaps=1) lists what the Catalogue cannot place or name, one rule per section, each row with the one action that fixes it. Up to 50 rows per rule are shown, then “Show all”.
| Rule | Detected when | Fix |
|---|---|---|
| Services without a placement | a service has no runs-on edge to a pod, K8s node, VM or host (a name seen only in traces counts only while it still has live calls) | Re-probe (front of the classifier queue) · This is an alias of… |
| Instances not on a VM | a database instance whose host matched no VM, or several (an instance whose link you switched off is left alone) | Pin to VM… → the Databases page, under “Where it runs” |
| Externals with a private address | a called host is a private, loopback or link-local address (IPv4 or IPv6) — something inside the estate | This is actually…, prefilled with the services on the VM, node or pod holding that address (≤ 8) |
| Unmonitored database hosts | traces reach a database on a host no monitored instance runs on | Add integration → the integration form with the type and host filled in |
| Databases known only by name | traces name a database but never its host (the spans carry db.name without server.address) | This is actually…, prefilled with the instances holding a database of that name, then those of the same engine (≤ 8) |
| Seen in network flows, not monitored | the hourly scan of the ClickHouse flow warehouse (24 h lookback) finds a private address answering on a database or queue port, scored low / medium / high from its clients, traffic shape and name, and no monitored instance runs there (see Network flows → Inferred databases and services) | Monitor this → the integration form as a draft prefilled from the flows · Not a database / Ignore (remembered across runs; owners and admins) |
- Re-probe and the alias fixes need edit rights on the integrations' owner; everyone else sees the candidates read-only. Pin to VM and Add integration open pages that check their own rights.
Change timeline and the weekly diff
The service page's Change timeline merges, newest first, the last 30 days (Load more reads 90; at most 200 entries): ownership edits and clears, health changes with their reasons, aliases set or removed, snoozes on findings of its hardware, vCenter events on its VMs and hosts, calls that started (“Started calling X”) and calls that went stale. Each row links to where it happened.
- What changed this week compares its call edges now with a daily snapshot of the call graph 7 days ago (or the nearest earlier day, which it names): new and gone edges, edges gone stale, error-rate changes (≥ 2× and ≥ 5 points) and call-volume changes (≥ 50 %). The dependency sweep writes the snapshot once a UTC day and keeps 90 days; before the first one it says so (“no snapshot yet — first one on …”) instead of showing zeros.
- The Catalogue header shows “N new edges, M stale this week” across everything you can see.
Exports and the ServiceNow CMDB import
Export ▾ in the header downloads services, instances or databases as CSV, or everything as JSON (topologix/catalogue/1); the service page's menu exports that one service with the instances it calls. A value nobody measured is an empty cell, never 0, and a cell that would start a spreadsheet formula is quoted. Every download is audited (catalog.export), and database names of an integration you cannot see are never in it.
- ServiceNow CMDB… downloads import-ready files for
cmdb_ci_service,cmdb_ci_db_instance,cmdb_ci_vmware_instance,cmdb_ci_esx_server,cmdb_rel_ci— one CSV per class, or all of them as one JSON. Every row carriessys_class_nameandcorrelation_id(our key), so an Import Set with a transform map that coalesces on correlation_id updates the same CI on every re-import instead of creating duplicates. Tier maps to business criticality, health to operational status; relationships (Runs on, Virtualized by, Depends on, Uses) are written only between CIs in the same export — load the CI classes first andcmdb_rel_cilast. - VMs and ESXi hosts ServiceNow Discovery already knows need a second coalesce (VM name, host serial number) or the Identification and Reconciliation Engine. Topologix does not write to the CMDB itself in this version.
Good to know
- Dynatrace reports
response.timein microseconds — Topologix converts to milliseconds everywhere, so the card and your threshold speak the same unit. - In the all-services alarm, breaching services get their recent Dynatrace events (deployments, error-rate increases, slowdowns) attached as drill-down rows — capped to the 12 worst services, 5 events each.
- Split-by-service metric queries cap at 1000 series per tick to bound tick latency on very large environments; topology needs no span pull at all — Smartscape’s
callsrelationships already model the graph. - Import → Discover from Traces accepts a Dynatrace integration as the trace source: “From a service” reads one service’s Smartscape
callsrelationships (no trace count needed), “Full architecture” pages every SERVICE entity and enriches the graph with p50 / p95 / error-rate / throughput from split metric queries. Selected Kubernetes clusters and vCenters place the services on namespaces, VMs and ESXi hosts; the import attaches an Avg Response Time source per service. The API token is enough — the Grail token is only needed for trace waterfalls.
More Monitoring & Observability integrations
See it on your own infrastructure
Book a demo and we will walk you through Topologix with your systems in mind: on our cloud, or self-hosted in your own network.