Status Page monitoring with Topologix
Monitoring & Observability
Watch a vendor’s public status page from your own canvas — active incidents, scheduled maintenances, and degraded components from any Atlassian Statuspage site (Cloudflare, GitHub, and many more), each with a deep link to the incident.
Requirements
- Outbound HTTPS from the Topologix server to the vendor’s status page — the integration reads the public
/api/v2/summary.json. - No credentials and no proxy agent — status pages are public by design.
1 · Set up the integration
- Open the Integrations pageClick Integrations in the toolbar and pick Status Page from the catalogue.
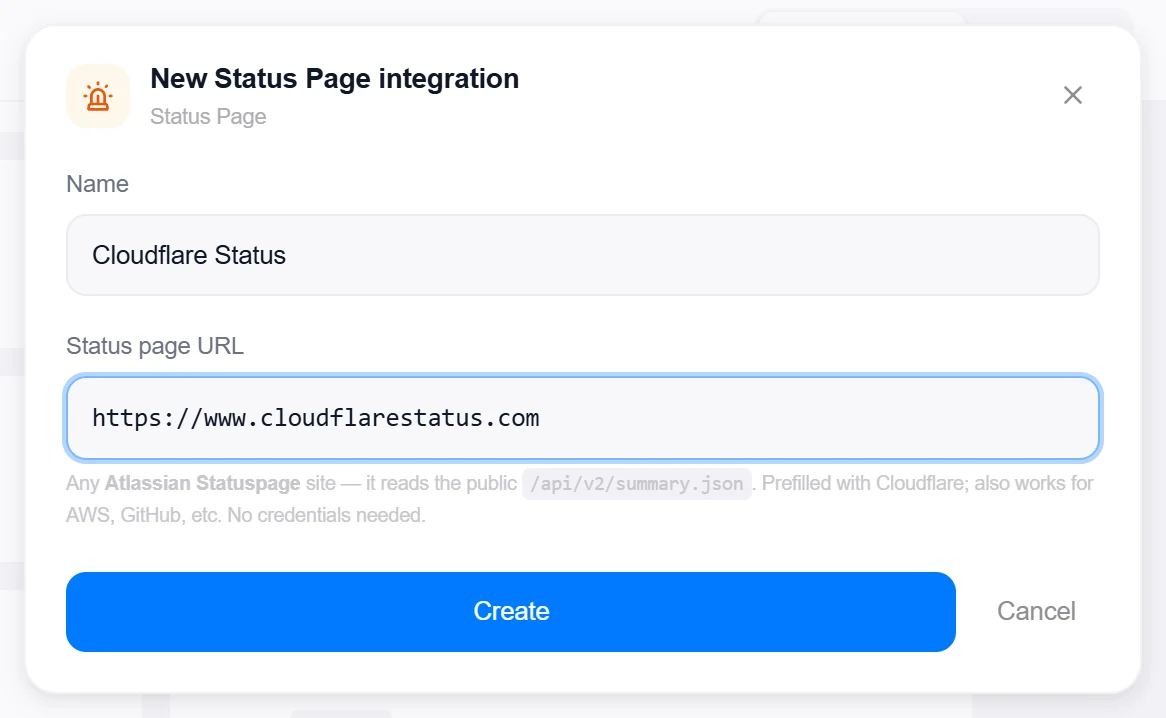
- Enter the status page URLThe page root, e.g.
https://www.cloudflarestatus.com. Any Statuspage.io-compatible site works — one integration per vendor. - Create, then verifyClick Create, then reopen the integration and click Test — it reads the summary and reports the page name, its overall indicator, and the active incident count. A 404 means the URL isn’t an Atlassian Statuspage site.

Target on a private network? Route it through a proxy agent. Proxy agents run inside your network — behind NAT, on a management VLAN, in an air-gapped segment — and reach targets the Topologix server can't. The agent polls the server every 15 seconds for its assignments, runs the checks locally, and pushes results back every 5 seconds, so no inbound firewall rules are ever needed. Set a default proxy on the integration; every metric source can override it. If a proxy goes offline, its sources are marked stale within ~90 seconds and the last known values stay visible.
2 · Add it to a flow
- Select the vendor nodeClick the node that represents the external dependency, open Metrics, then + Add and choose the Status Page integration.
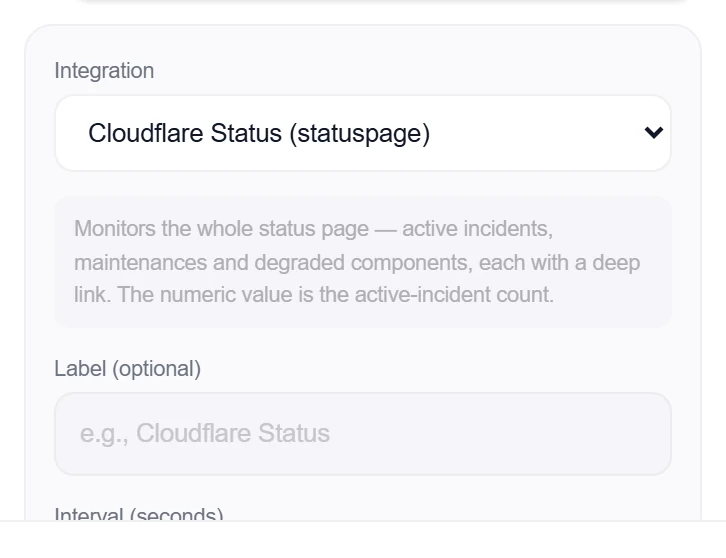
- Add the sourceOne source monitors the whole page — the only field is an optional Label (e.g. “Cloudflare Status”).
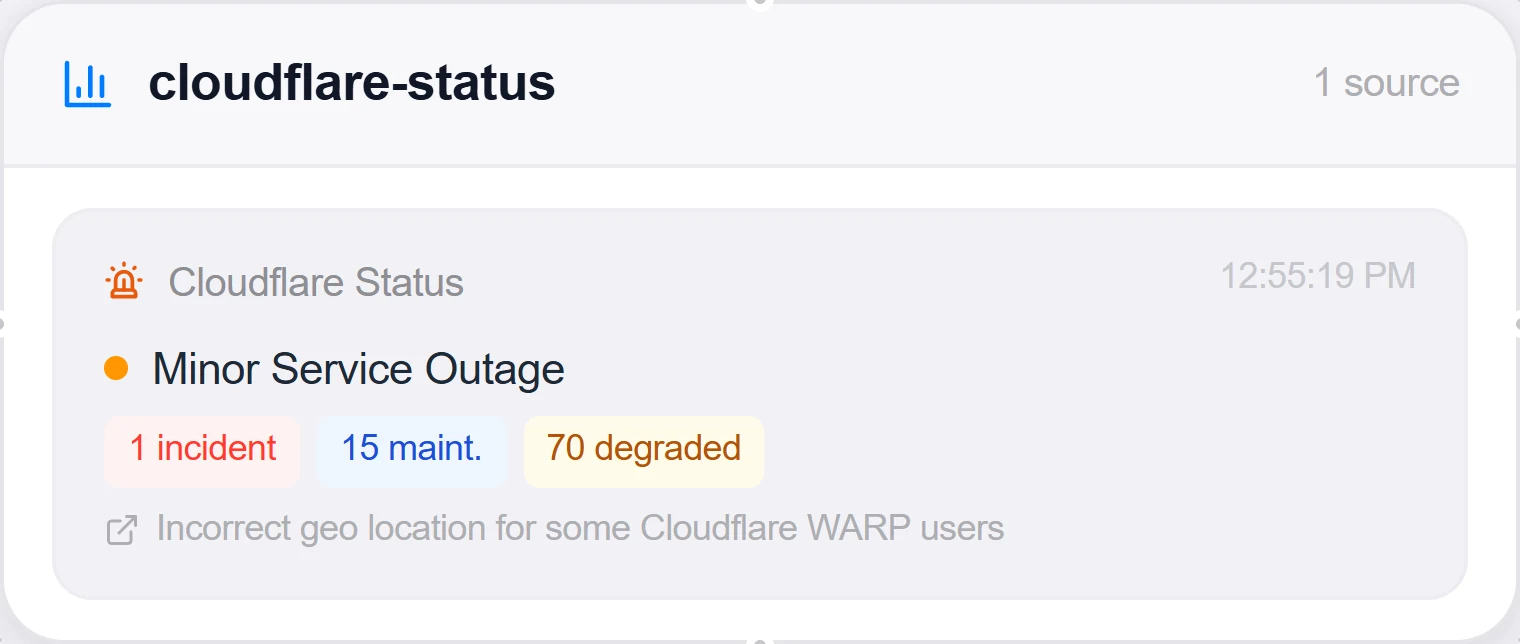
- SaveSet the interval and click Add Source. The card lists active incidents, maintenances, and degraded components, each deep-linking to the vendor’s incident page.
Good to know
- The card’s numeric value is the active-incident count — a threshold of 0 turns the node red the moment the vendor opens any incident, and drives your alert rules.
- The overall indicator (none / minor / major / critical / maintenance) and the vendor’s own status description ride along, so the card reads like the page’s header.
- Maintenances include their scheduled windows — upcoming vendor work shows up before it starts.
- AWS is not an Atlassian Statuspage, and this integration cannot track it. Both
health.aws.amazon.comandstatus.aws.amazon.comanswer 404 on/api/v2/summary.json— there is no Statuspage behind either host, so no URL you enter here will work. Use the AWS Account integration’s Health mode instead: it reads AWS’s own public current-events feed (and, with a Business or Enterprise support plan, your account’s personalised events), scoped to the services and regions you run in.
More Monitoring & Observability integrations
See it on your own infrastructure
Book a demo and we will walk you through Topologix with your systems in mind: on our cloud, or self-hosted in your own network.