JVM (JMX / Jolokia) monitoring with Topologix
Monitoring & Observability
JVM internals over HTTP — no RMI, no agent JAR shipped by Topologix — with a health suite covering heap, old-gen, metaspace, GC overhead, full-GC rate, deadlocks, threads, CPU, and file descriptors, plus 53 presets across memory, GC, threads, runtime, and the Kafka / ActiveMQ / Cassandra product packs.
Requirements
- One of three HTTP transports on the JVM: a Jolokia agent (JMX → JSON), a Spring Boot Actuator with the Prometheus endpoint, or any Micrometer / JMX-exporter /metrics exposition. Native JMX over RMI is intentionally unsupported — attach a Jolokia agent instead.
- HTTP(S) reach from the Topologix server or a proxy agent to that endpoint. Optional Basic auth; self-signed HTTPS is accepted by unticking Verify TLS certificate.
1 · Set up the integration
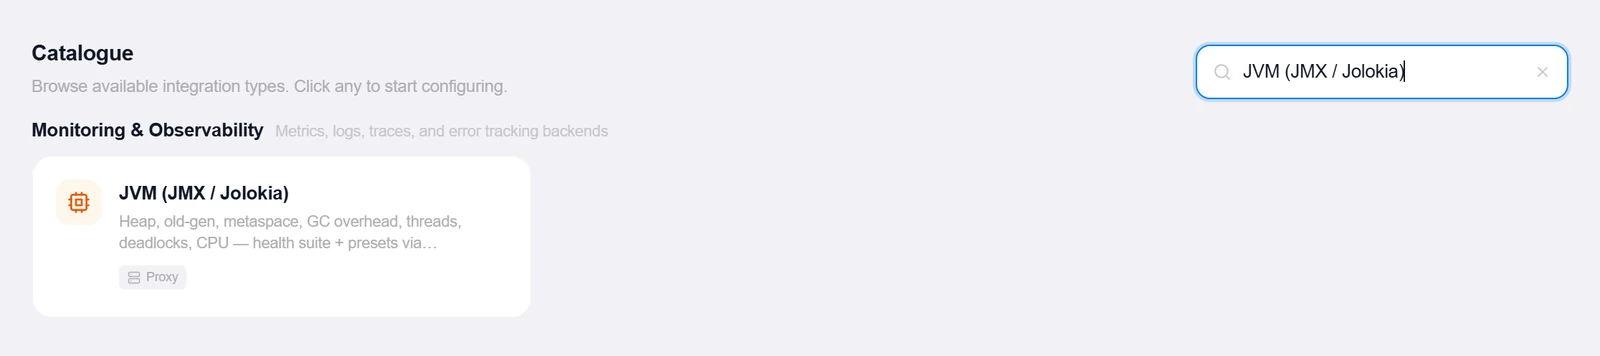
- Open the Integrations pageClick Integrations in the toolbar and pick JVM (JMX / Jolokia) from the catalogue.
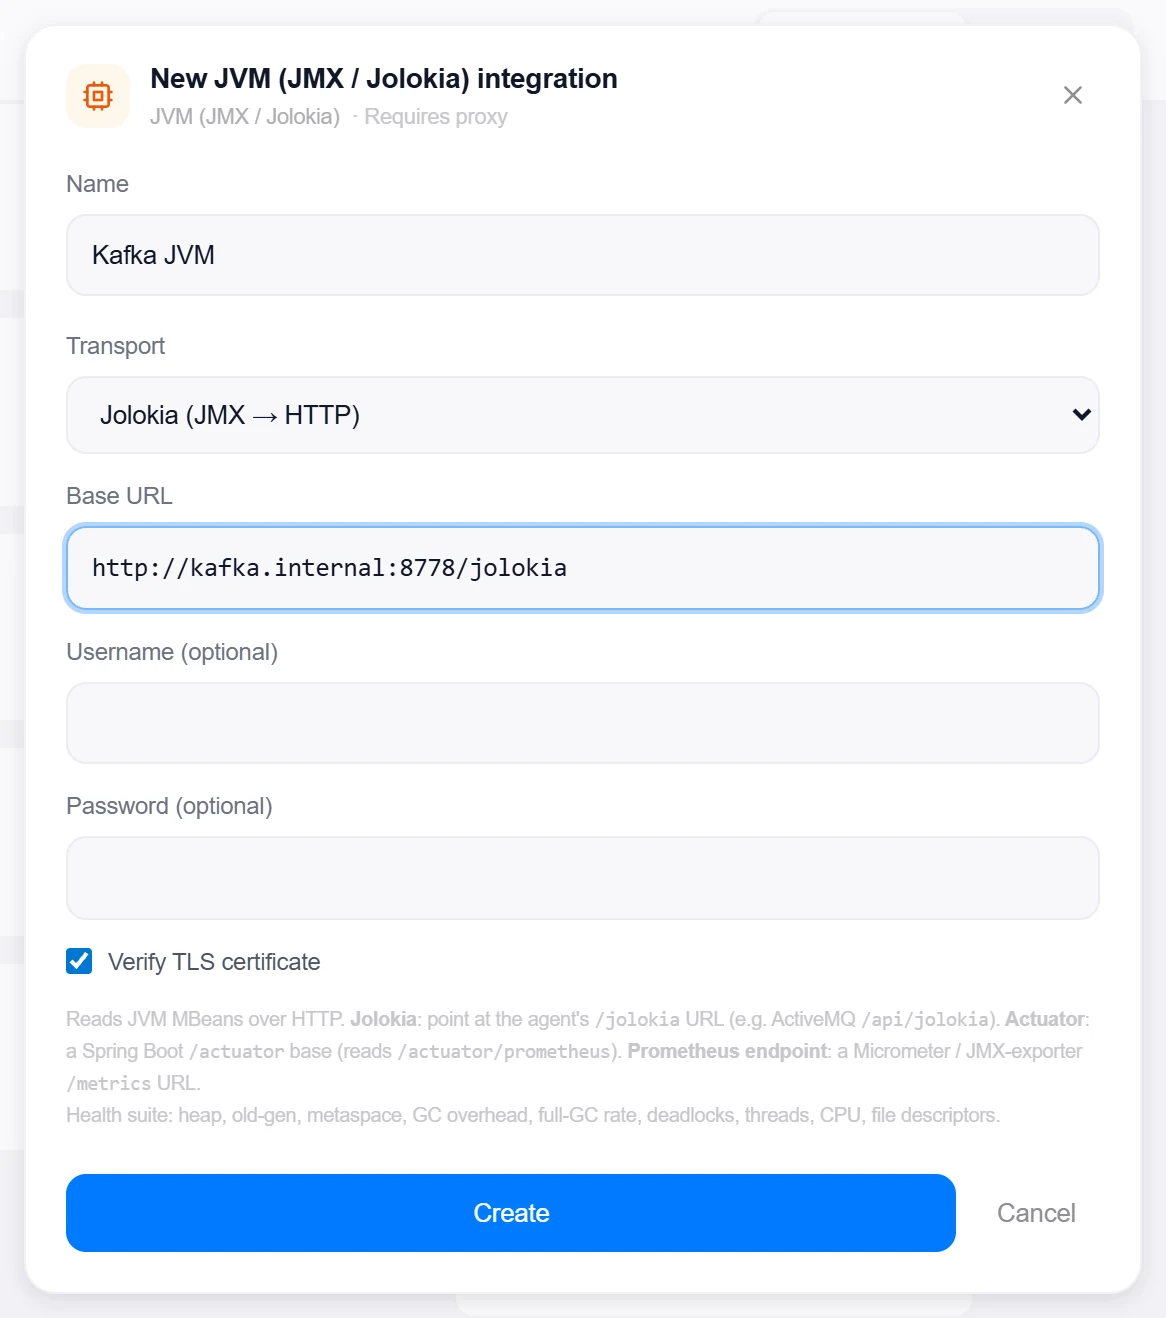
- Pick the transportJolokia (JMX → HTTP), Spring Boot Actuator, or Prometheus / Micrometer endpoint — the Base URL placeholder follows along:
http://host:8778/jolokia,http://host:8080/actuator, orhttp://host:8080/metrics. - Enter the base URL and credentialsPlus optional Username/Password for Basic auth. ActiveMQ’s embedded Jolokia lives at
/api/jolokia; Actuator URLs get/prometheusappended automatically. - Create, then verifyClick Create, then reopen the integration and click Test — it reads a full metrics snapshot and reports the VM it found (“Connected — OpenJDK 64-Bit Server VM 17.0.10 — heap 43%”).
2 · Add it to a flow
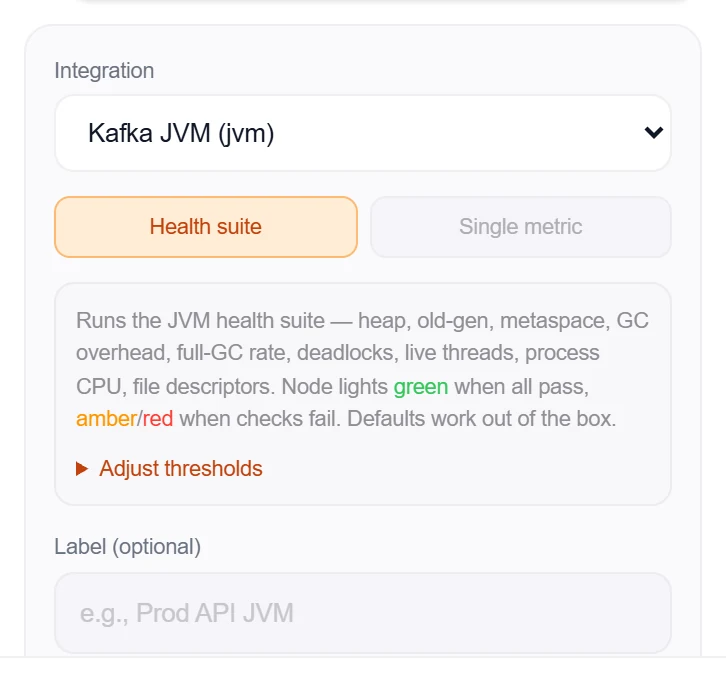
- Select the service nodeClick the node, open Metrics, then + Add and choose the JVM integration.
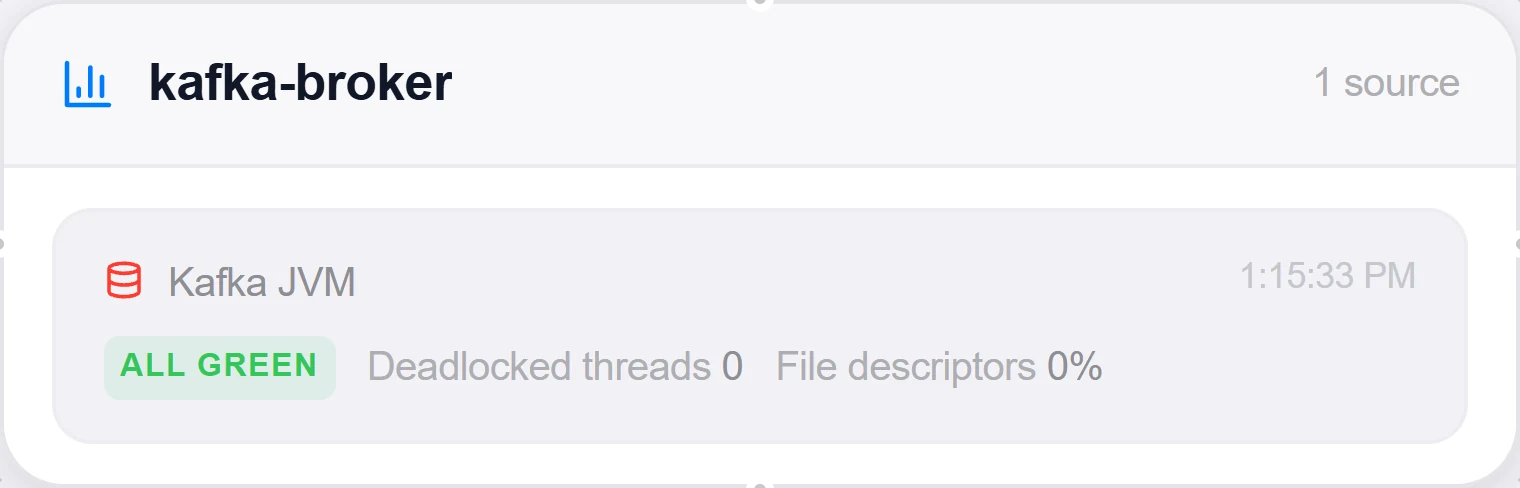
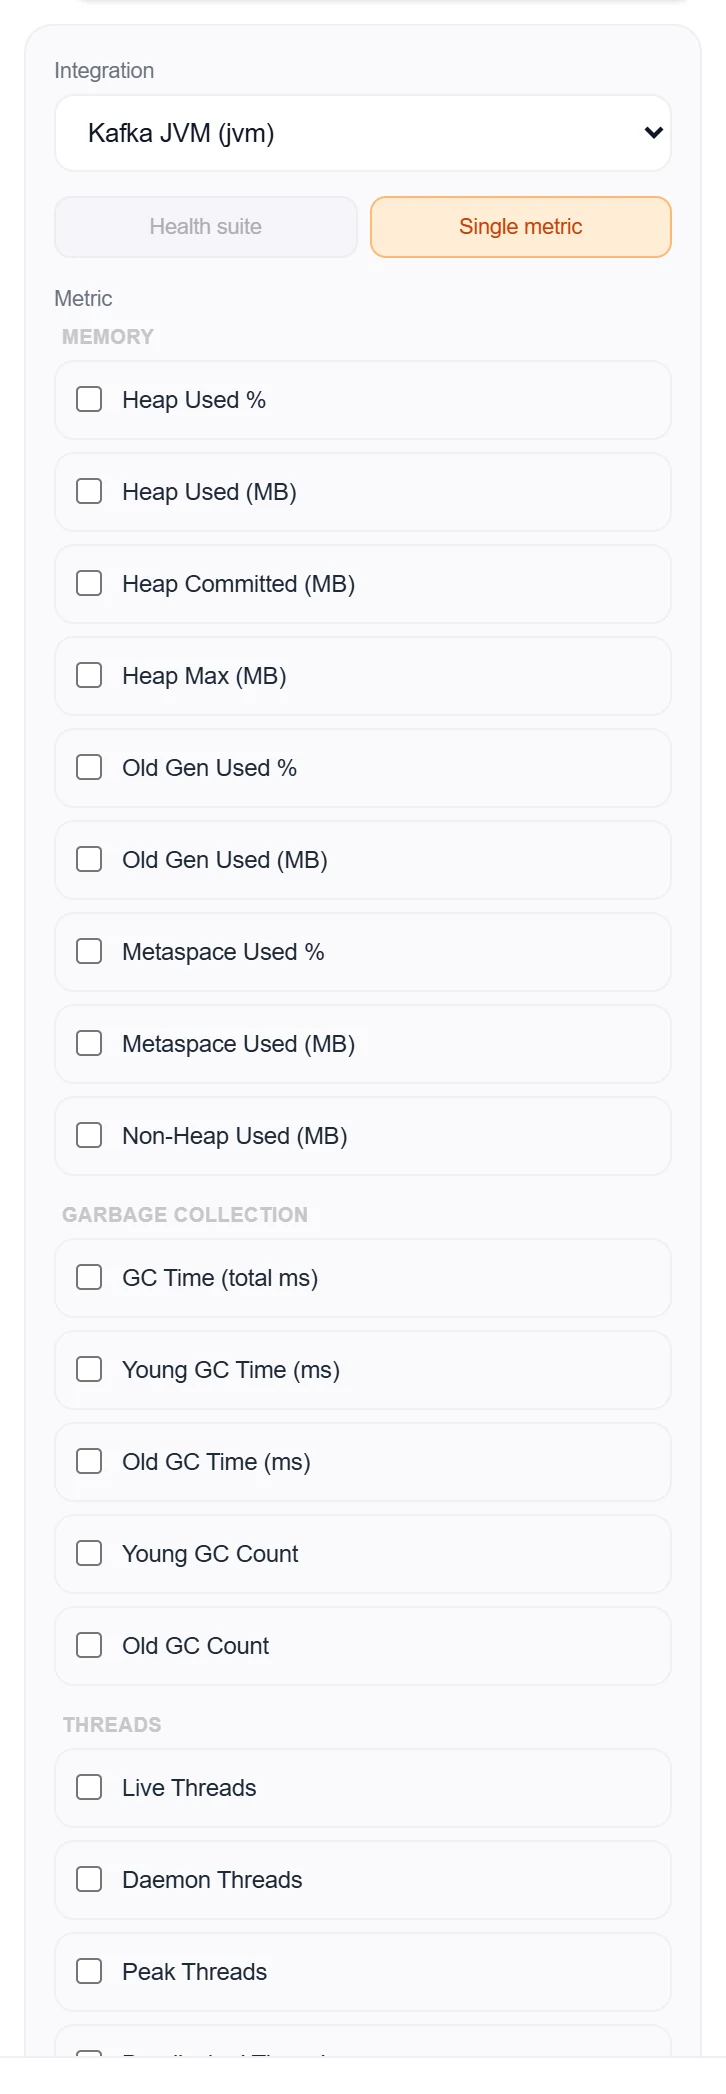
- Pick a modeTwo tabs: Health suite (the default) runs the full check suite and paints pass/fail chips on the card; Single metric charts one preset — multi-select creates one source per metric.
- SaveOptionally adjust per-check thresholds, set the interval, and click Add Source. Health failures turn the node red and drive alert rules per check.
3 · Beyond presets: custom queries & the All-Services alarm
Health suite
JVM up, heap utilization, old-gen utilization (stays high after GC = leak), metaspace utilization, GC overhead as % of wall-clock, full-GC frequency per minute, deadlocked threads, live thread count, process CPU, and file descriptors — one snapshot per poll, whatever the transport.
- GC overhead and full-GC frequency are counter deltas between polls — the first sample reads “n/a”, every later one is a true rate.
- Fields a transport can’t supply degrade to “n/a”, never a false alarm — unbounded metaspace, file descriptors on Windows, deadlock detection when Jolokia’s exec is restricted. Under G1’s elastic young gen, heap max can be unknowable from Prometheus metrics; old-gen utilization carries the saturation signal instead.
Single metric
One preset, one number: heap / old-gen / metaspace %, GC time and counts, thread counts, process and system CPU, file descriptors, uptime — plus product-pack presets that read Kafka broker, ActiveMQ Classic, and Cassandra MBeans over the same connection. Ticking several presets creates one source per metric in a single pass.
- The product packs are Jolokia-only and ride the same bulk request as the base suite — under-replicated partitions and active-controller count for Kafka, store/memory/temp %-usage for ActiveMQ, pending compactions and latency p95 for Cassandra.
Good to know
- On Jolokia, each poll is a single bulk POST covering the whole MBean suite — one HTTP round-trip regardless of how many checks run.
- The Prometheus parser understands all three common dialects — Micrometer, JMX-exporter, and the OTel Java agent — so the same integration reads whichever your service exposes.
More Monitoring & Observability integrations
See it on your own infrastructure
Book a demo and we will walk you through Topologix with your systems in mind: on our cloud, or self-hosted in your own network.