REST / JSON API monitoring with Topologix
Monitoring & Observability
One poller for anything that speaks JSON over HTTP: 22 vendor packs turn well-known APIs (RabbitMQ, Elasticsearch, Jenkins, Grafana, Vault, Argo CD…) into ready-made cards, and custom mode charts any number a JSON endpoint returns via a dot-path — no bespoke integration required.
Requirements
- HTTP(S) reach from the Topologix server or a proxy agent to the API. Self-signed endpoints are accepted with the Skip TLS certificate verification toggle.
- Credentials to match the API: None, Basic, Bearer token, Custom header key (e.g.
X-Api-Key), or OAuth2 client credentials — tokens are fetched and cached automatically.
1 · Set up the integration
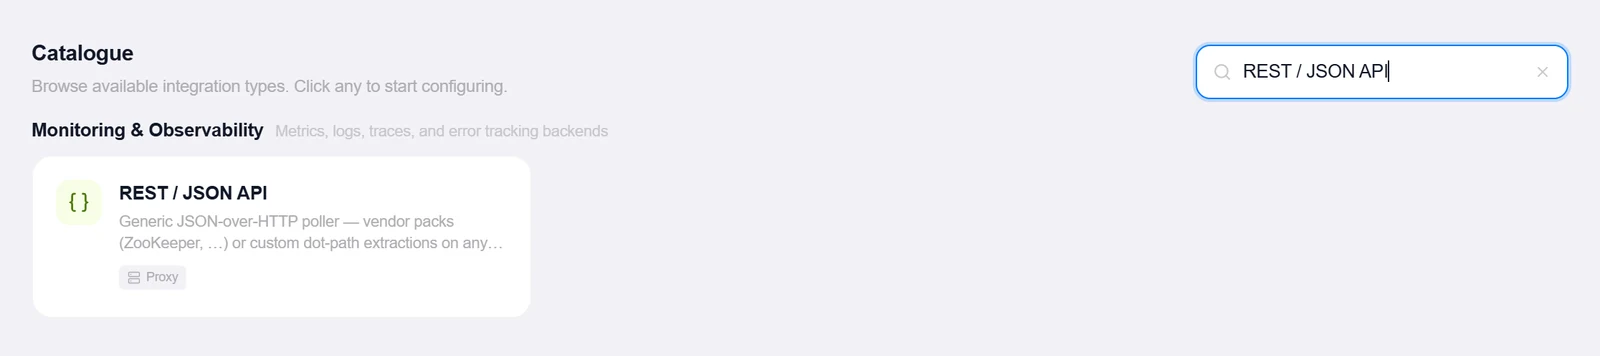
- Open the Integrations pageClick Integrations in the toolbar and pick REST / JSON API from the catalogue.
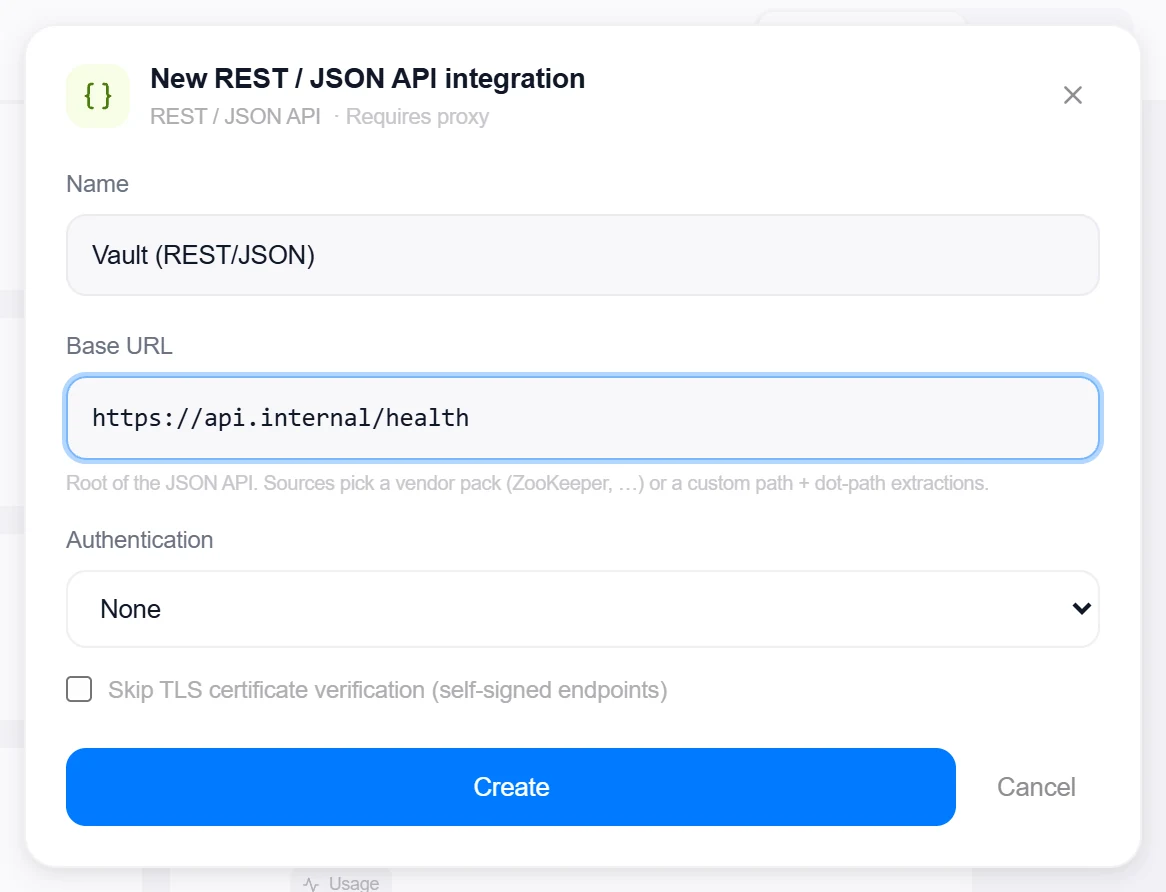
- Enter the base URLThe root of the JSON API — e.g.
http://zookeeper.lan:8080. Sources add the vendor pack’s endpoints or your custom path under it. - Choose authenticationOne of the five modes; OAuth2 takes a Token URL, Client ID/secret, and optional Scope.
- Create, then verifyClick Create, then reopen the integration and click Test — it GETs the pack’s test endpoint (or the API root) and reports the JSON it found (“Connected. GET /commands/ruok returned JSON…”); Prometheus-format packs report the sample count instead.
2 · Add it to a flow
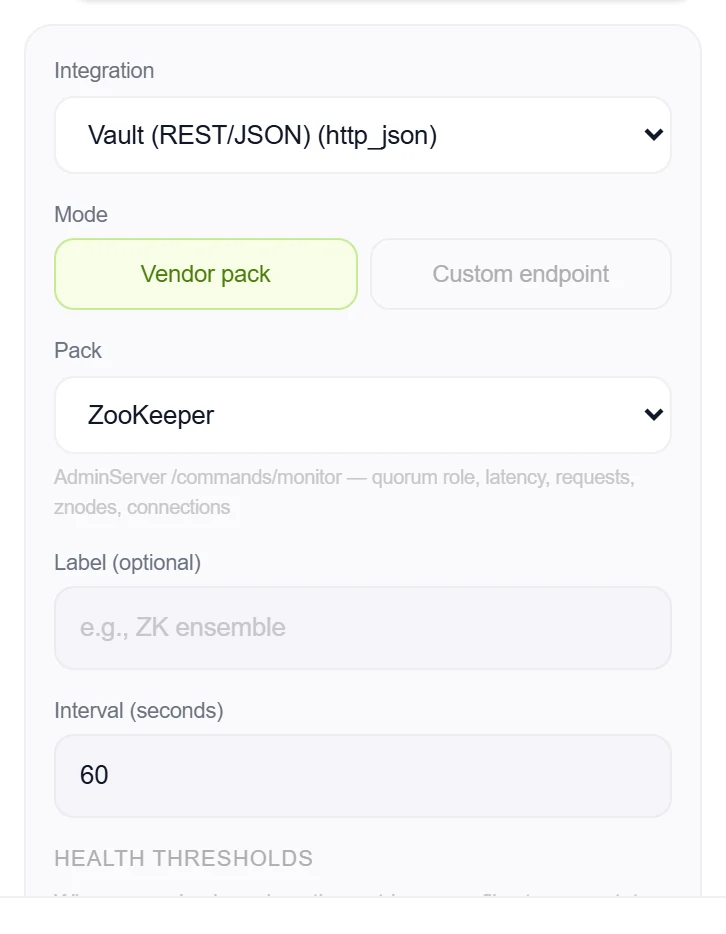
- Select the service nodeClick the node, open Metrics, then + Add and choose the REST / JSON API integration.
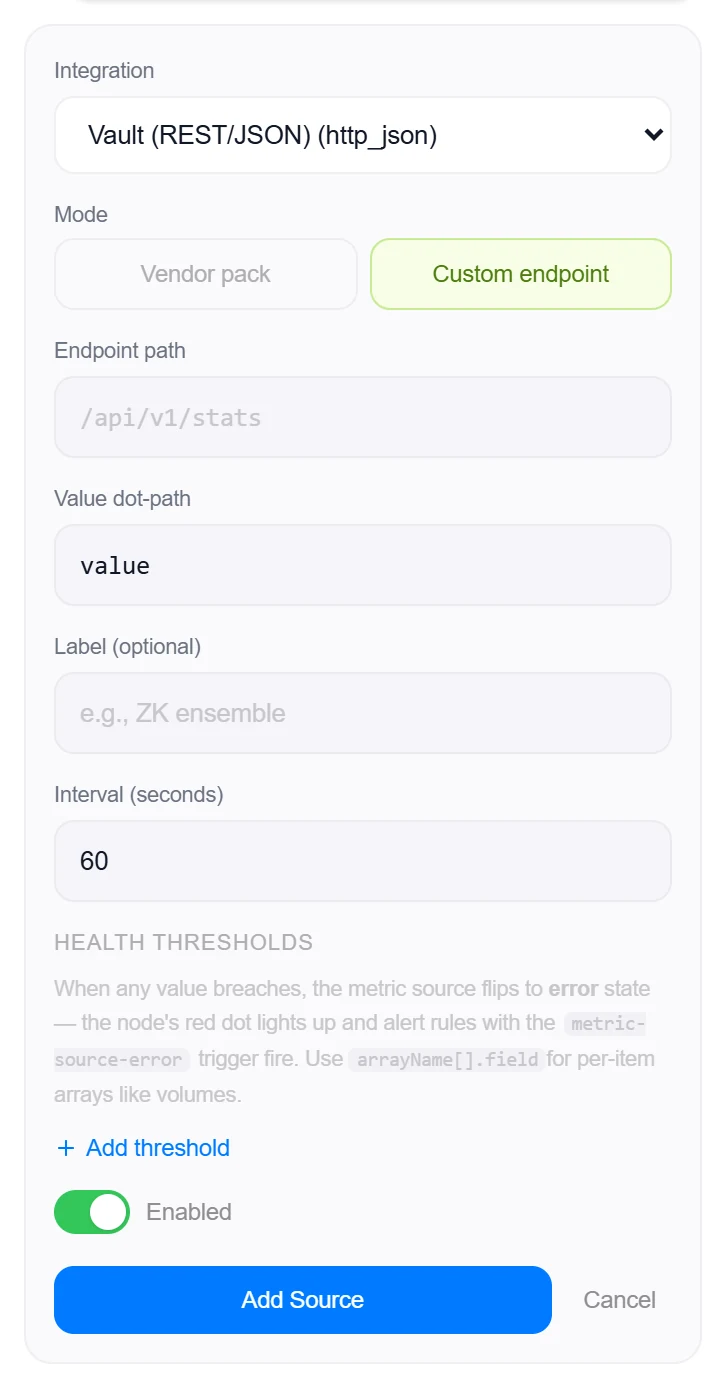
- Pick a modeTwo tabs: Vendor pack (pick a pack from the dropdown — each shows what it monitors) or Custom endpoint (an Endpoint path plus a Value dot-path into the response).
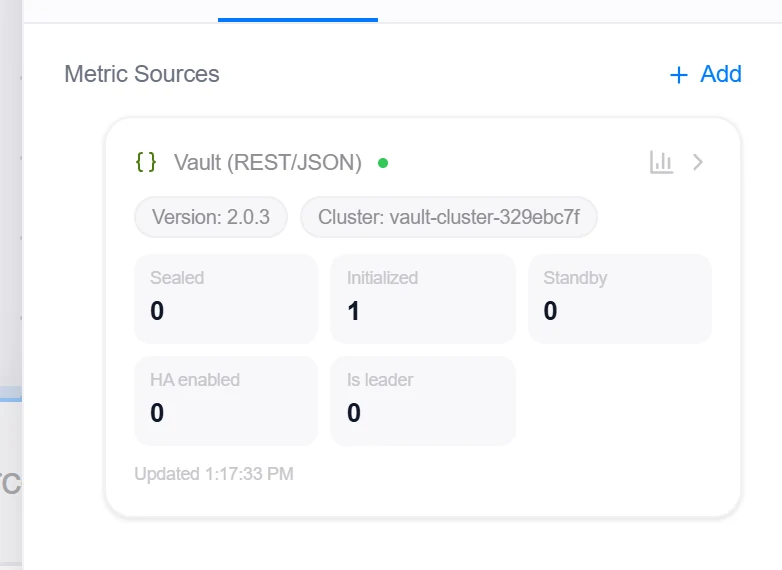
- SaveSet the interval and click Add Source. Pack cards show every extracted number plus attention lists; custom cards chart the one value you pointed at.
3 · Beyond presets: custom queries & the All-Services alarm
Vendor packs
A pack is a curated endpoint set plus extraction rules — the numbers that matter, labeled the way the vendor’s own UI labels them. 22 packs ship today, from message brokers (RabbitMQ, NATS) and search (Elasticsearch / OpenSearch, Splunk) to CI and delivery (Jenkins, Argo CD), gateways (Kong, Traefik, Envoy, nginx, Apache httpd), and infrastructure staples (HashiCorp Vault, ZooKeeper, etcd, Keycloak, Grafana, MinIO, Uptime Kuma, Netdata, Icinga 2, Checkmk, LibreNMS).
- Attention lists name the broken things — OutOfSync Argo CD apps, down Uptime Kuma monitors — with drill-down rows and, where the vendor UI allows it, a deep link straight to the object.
- Some packs read Prometheus expositions instead of JSON (etcd, Uptime Kuma) — same integration, same card.
Custom endpoint
Any JSON API becomes a metric: enter the endpoint path and a dot-path to the value — data.count, or items.0.value with array indices. The extracted number is charted, thresholded, and alerted on like any preset.
- Booleans coerce to 0/1, so health flags are directly alertable.
- All five auth modes from the integration apply unchanged — one authenticated integration can back many custom sources.
Good to know
- Current pack registry: ZooKeeper, HashiCorp Vault, Netdata, NATS, Traefik, Apache httpd, MinIO, Uptime Kuma, Kong, Envoy, RabbitMQ, Grafana, Icinga 2, Jenkins, Checkmk, nginx, Keycloak, LibreNMS, Splunk, Elasticsearch / OpenSearch, Argo CD, etcd.
- Drill-down lists are capped (25 rows per tile, 50 attention rows) but the headline number is always the true count — a truncated list never shrinks what it reports.
- OAuth2 tokens are cached until shortly before expiry (60 s safety margin), so polling doesn’t hammer your IdP.
More Monitoring & Observability integrations
See it on your own infrastructure
Book a demo and we will walk you through Topologix with your systems in mind: on our cloud, or self-hosted in your own network.