Sentry monitoring with Topologix
Monitoring & Observability
Application errors from Sentry — sentry.io SaaS or self-hosted — as canvas metrics: the accepted error-event count over a chosen window, or the live unresolved-issue count, per project.
Requirements
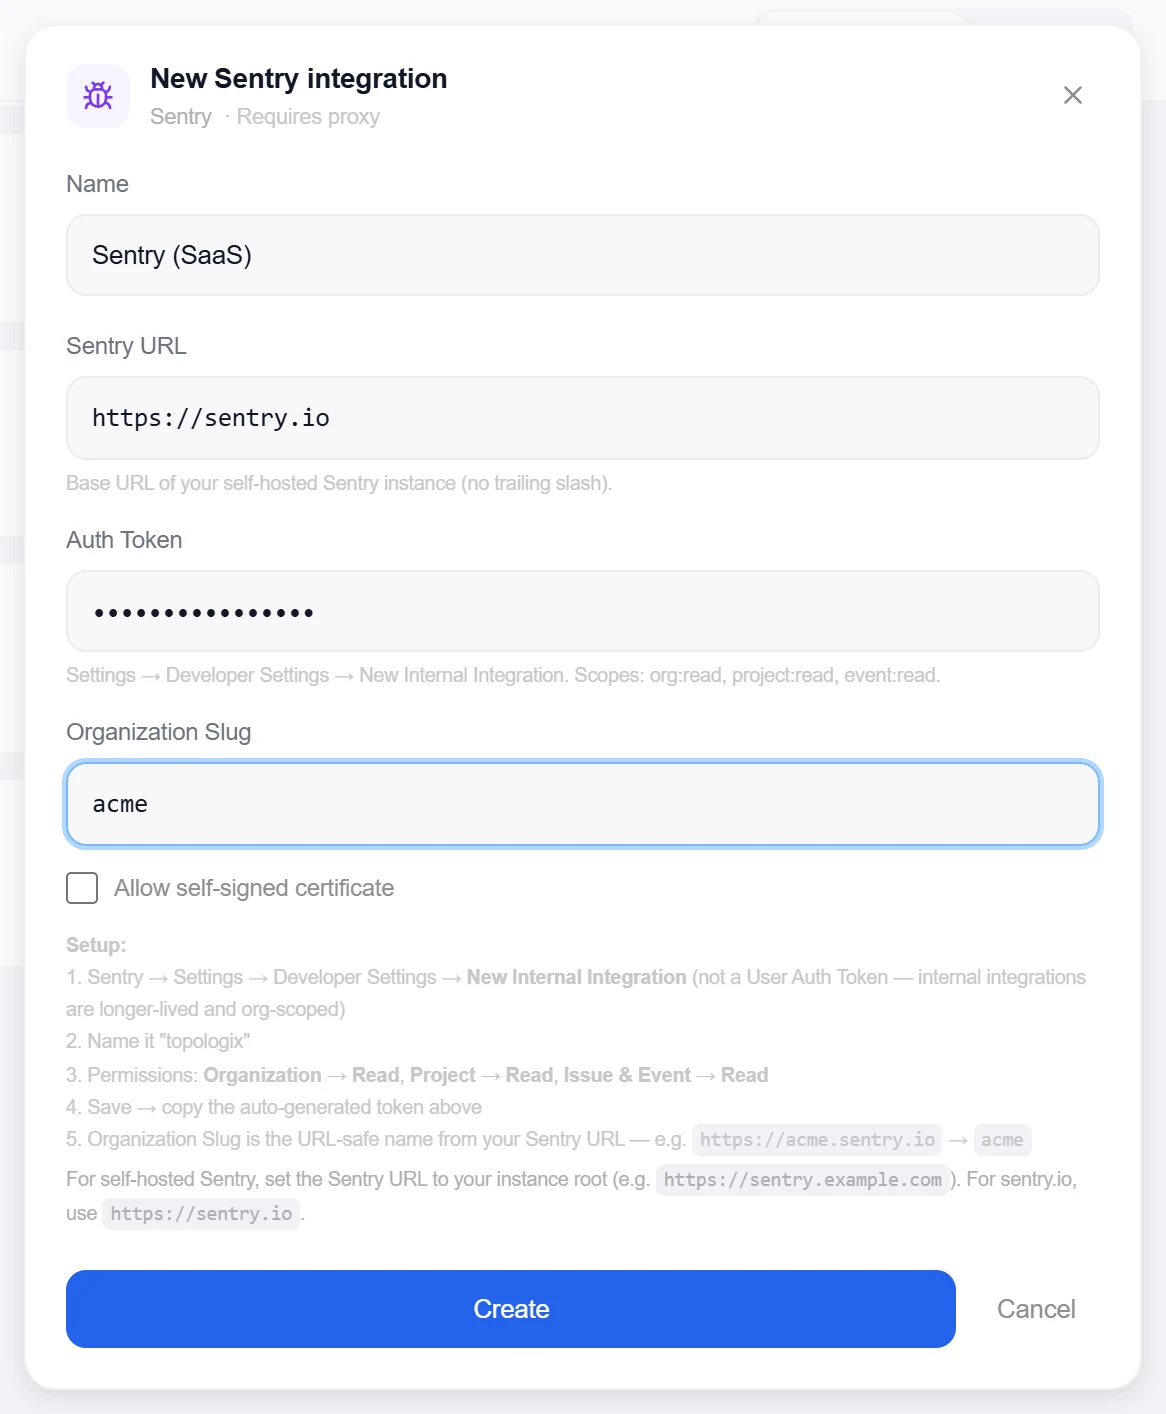
- An Internal Integration token (Sentry → Settings → Developer Settings → New Internal Integration) with
org:read,project:readandevent:readscopes — not a User Auth Token; internal integrations are longer-lived and org-scoped. - Your Organization Slug — the URL-safe org name (e.g.
https://acme.sentry.io→acme). - Outbound HTTPS to
sentry.ioor your instance root; self-signed instances are accepted with Allow self-signed certificate.
1 · Set up the integration
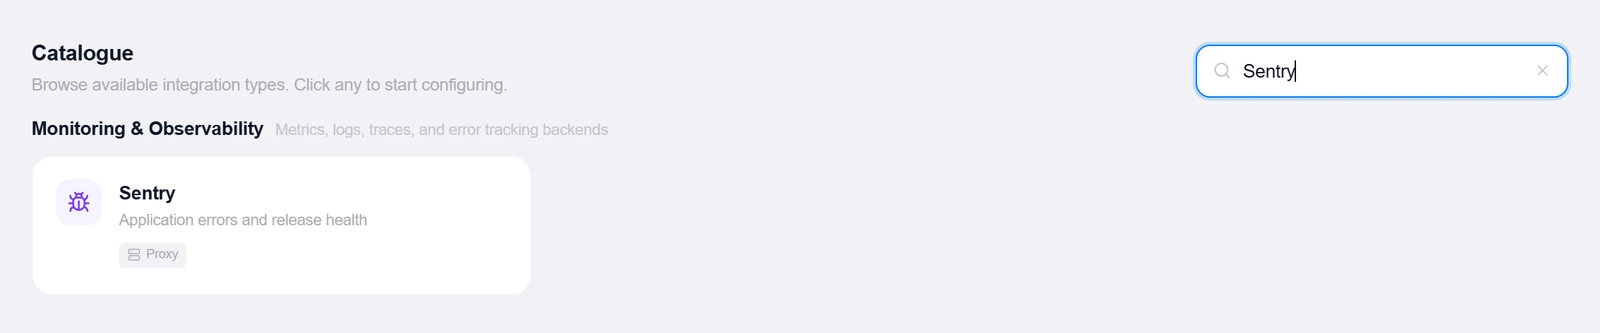
- Open the Integrations pageClick Integrations in the toolbar and pick Sentry from the catalogue.
- Enter the Sentry URL
https://sentry.iofor SaaS, or your self-hosted instance root (no trailing slash). - Paste the Auth Token and Organization SlugThe drawer walks through creating the Internal Integration step by step — Permissions: Organization → Read, Project → Read, Issue & Event → Read — then copy its auto-generated token.
- Create, then verifyClick Create, then reopen the integration and click Test — it verifies the token against the org and counts projects: “Connected — org Acme, 12 project(s)”.
Target on a private network? Route it through a proxy agent. Proxy agents run inside your network — behind NAT, on a management VLAN, in an air-gapped segment — and reach targets the Topologix server can't. The agent polls the server every 15 seconds for its assignments, runs the checks locally, and pushes results back every 5 seconds, so no inbound firewall rules are ever needed. Set a default proxy on the integration; every metric source can override it. If a proxy goes offline, its sources are marked stale within ~90 seconds and the last known values stay visible.
2 · Add it to a flow
- Select the service nodeClick the node, open Metrics, then + Add and choose the Sentry integration.
- Pick a query mode and projectThree tabs: Event Count, Unresolved Issues or Errors per project (every project at once, with baselines — below). The Project dropdown auto-populates from the org (falls back to a numeric project-ID input).
- Scope and saveEvent Count takes a Range — 1 hour, 24 hours, 7 days, or 30 days — then add a label, set the interval, and click Add Source. A threshold on either count turns the node red on error storms or an issue backlog.
Live canvas screenshots for this integration require a real Sentry environment, so this guide shows the configuration screens only — the flow steps above work exactly like every other integration.
3 · Errors per project
Errors per project
One source that counts error events for every project of the organisation over each check — the project is the “service” — with the log error baselines of the Graylog All Services source: usual count per weekday and hour, breach rule, new-type warnings, banner, Alerts page and the Catalogue Logs section. Optional search and environment narrow it.
- Sentry API calls per check: 2, or 3 when the project list is refreshed (at most hourly) — the per-project totals and the per-issue counts from the Discover events endpoint (
dataset=errors), plus/projects/. Poll every 60 seconds or slower. - The token needs
event:read(andorg:readfor the project list). Without them the source reads no value with “the token needs the event:read scope”, never 0. A refused project list only loses the zeros. - Error types are the issue titles (exact counts) — the top 100 project × title pairs a check; the rest count as
(other). Projects with no errors in the window read a measured 0 once the project list is known. - The window is the polling interval and ends 60 s before now, so events still being ingested are not missed. There are no sample lines — View logs is not offered; open the issue in Sentry.
- Polled through a proxy: proxy 1.219.0 or newer — there is no version gate, so update the proxy before creating the source there.
Good to know
- Event Count reads Sentry’s
stats_v2— accepted error-category events, i.e. what Sentry actually ingested after its rate limits and filters, not what clients attempted to send. - Unresolved Issues pages through the issue list 100 at a time with a 1000-issue safety cap — beyond that the count reads 1000.
More Monitoring & Observability integrations
See it on your own infrastructure
Book a demo and we will walk you through Topologix with your systems in mind: on our cloud, or self-hosted in your own network.