Graylog monitoring with Topologix
Monitoring & Observability
Turn Graylog log volumes into metrics — error counts, HTTP 5xx, any Lucene query — with 20 presets, per-stream scoping, and an All-Services alarm that learns every service’s usual error count and alerts on the deviation. The same integration feeds the AI log analysis and the Monitoring bot.
Requirements
- A Graylog access token (recommended) or username/password; token mode authenticates as
token:token. - HTTPS/HTTP reach to the Graylog REST API (the same base URL the Graylog UI uses).
1 · Set up the integration
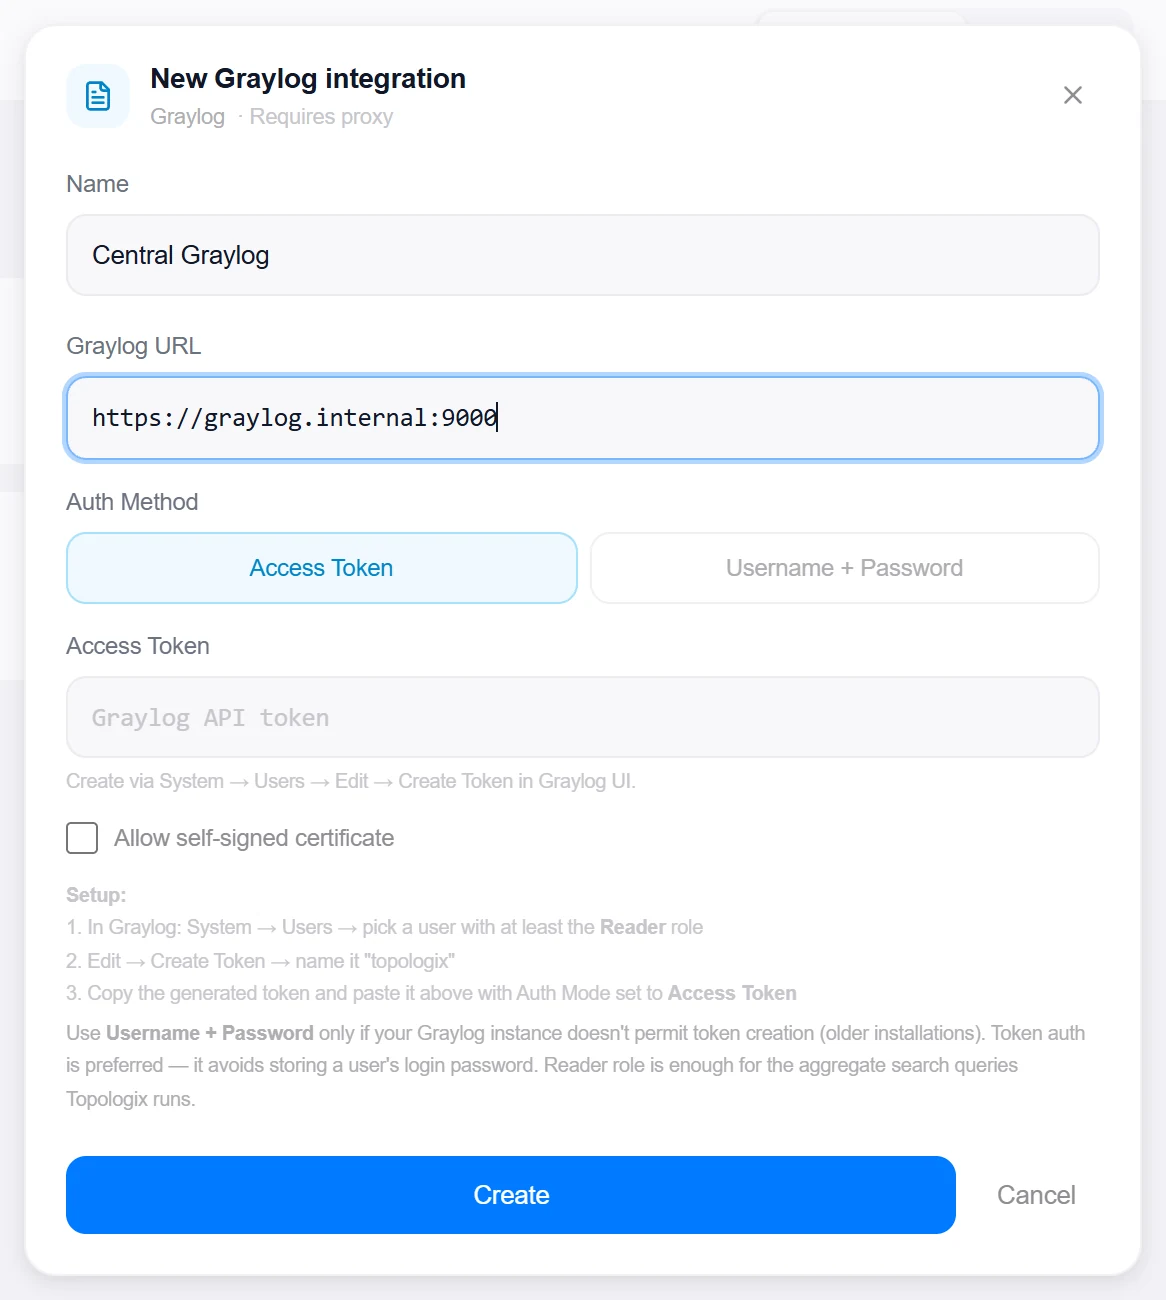
- Open the Integrations pageClick Integrations in the toolbar and pick Graylog from the catalogue.
- Enter the base URL and tokenThe Graylog root URL and an access token created under System → Users → Edit tokens.
- Create, then verifyClick Create, then reopen the integration and click Test — it calls the cluster endpoint and reports the Graylog version it found.

2 · Add it to a flow
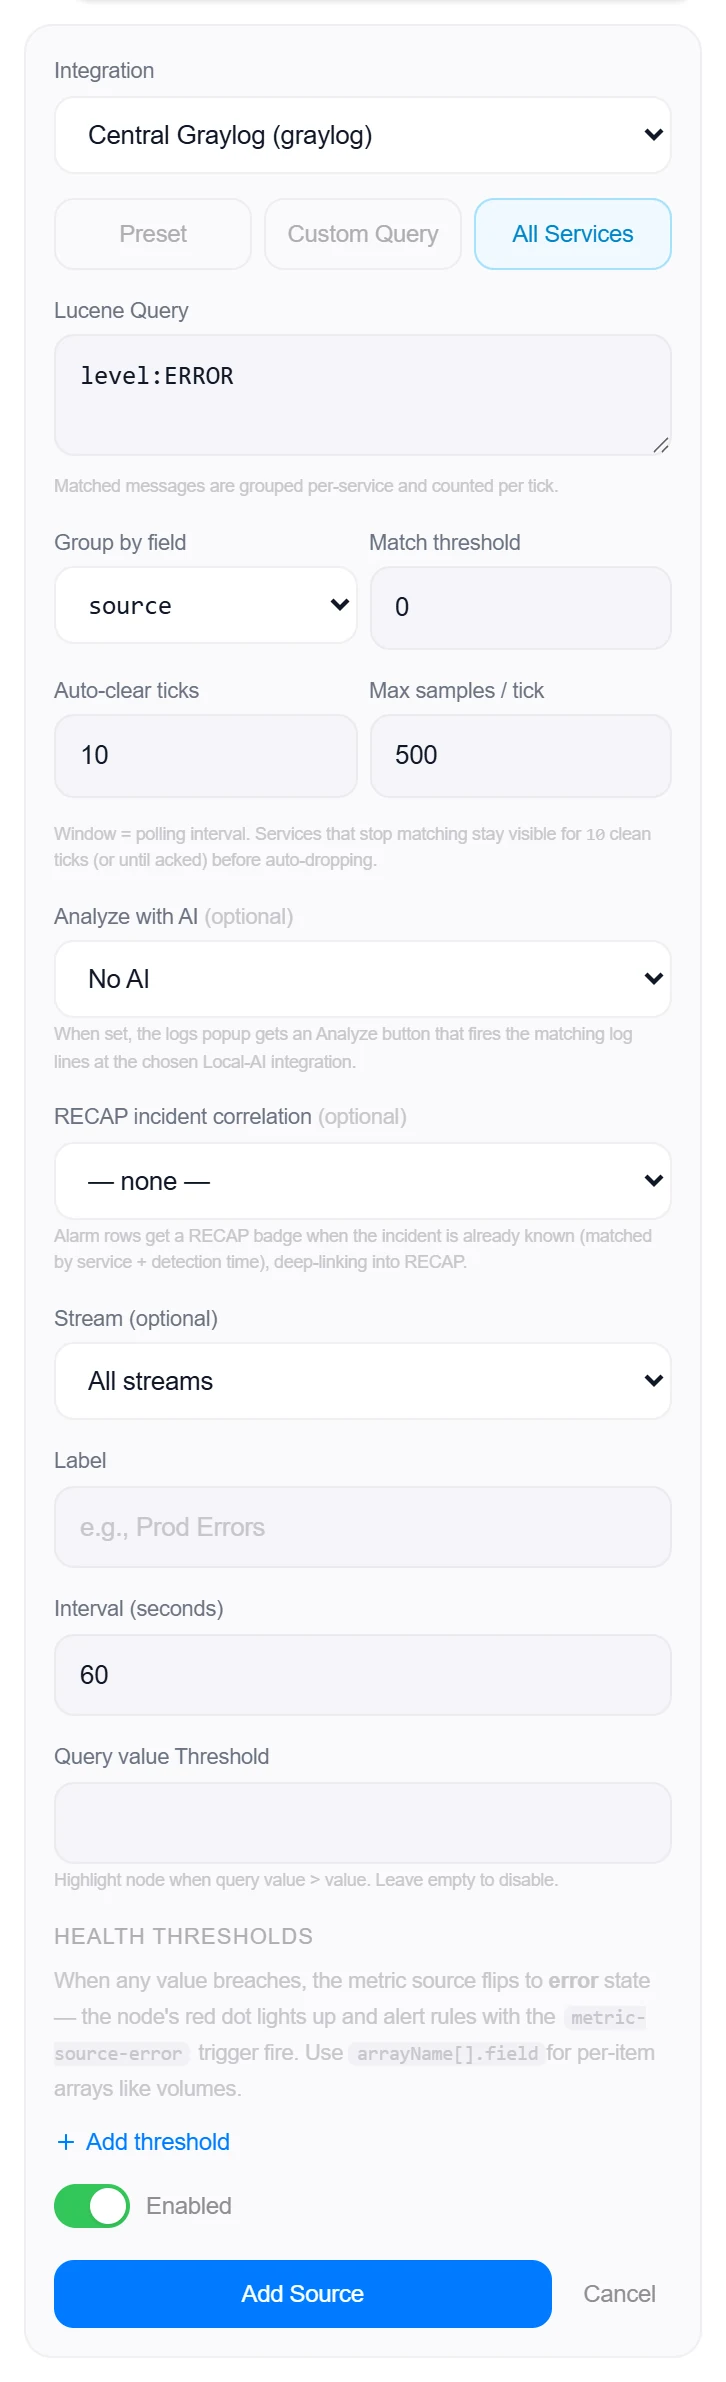
- Select the service nodeClick the node, open Metrics, then + Add and choose the Graylog integration.
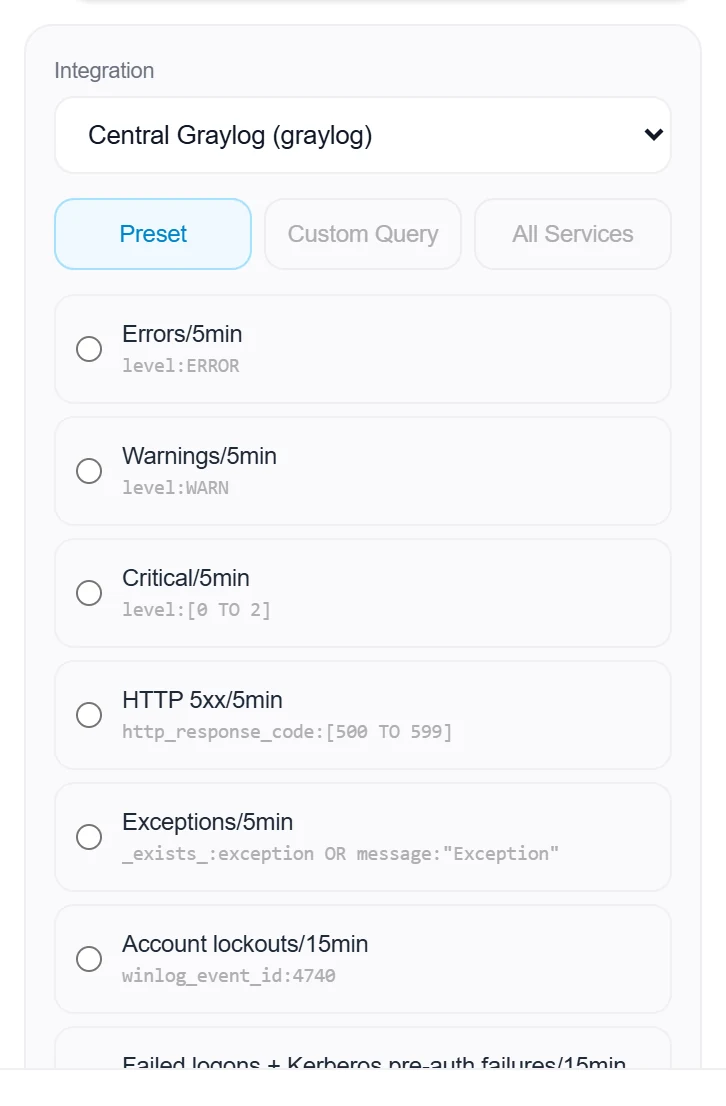
- Pick a preset or write a queryPresets cover errors, warnings, criticals, HTTP 5xx and more; custom mode accepts the same Lucene syntax as the Graylog search bar, optionally scoped to a stream.
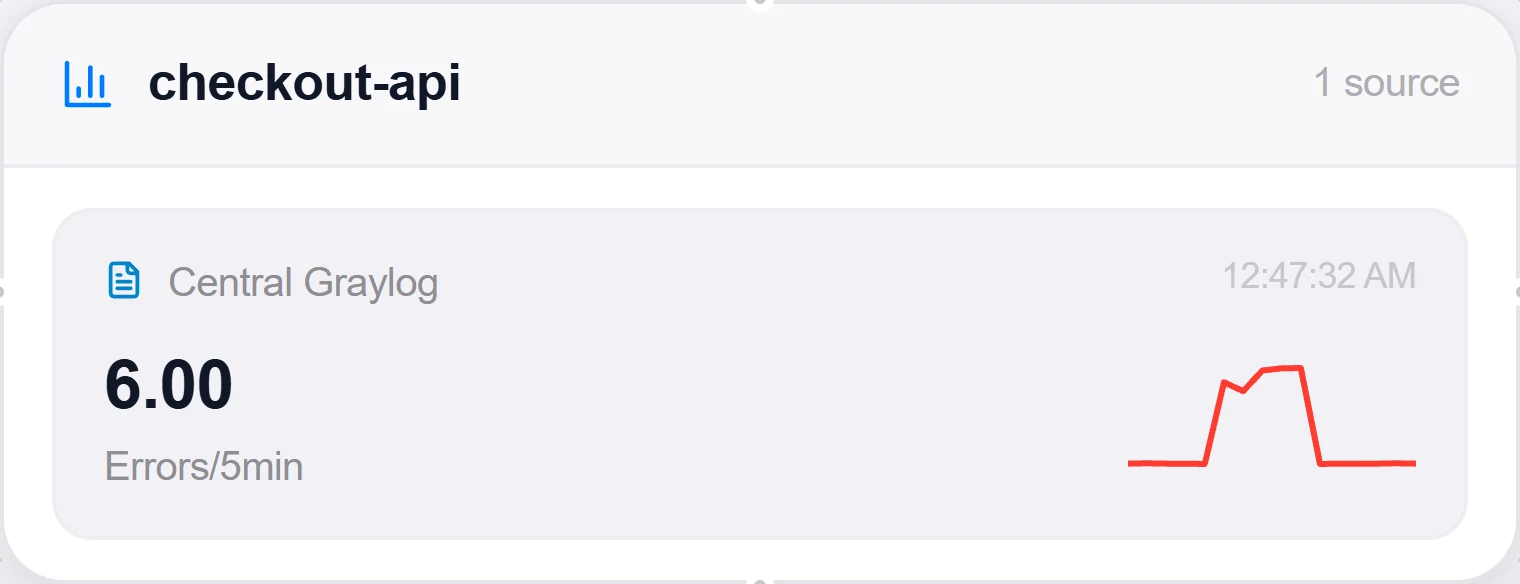
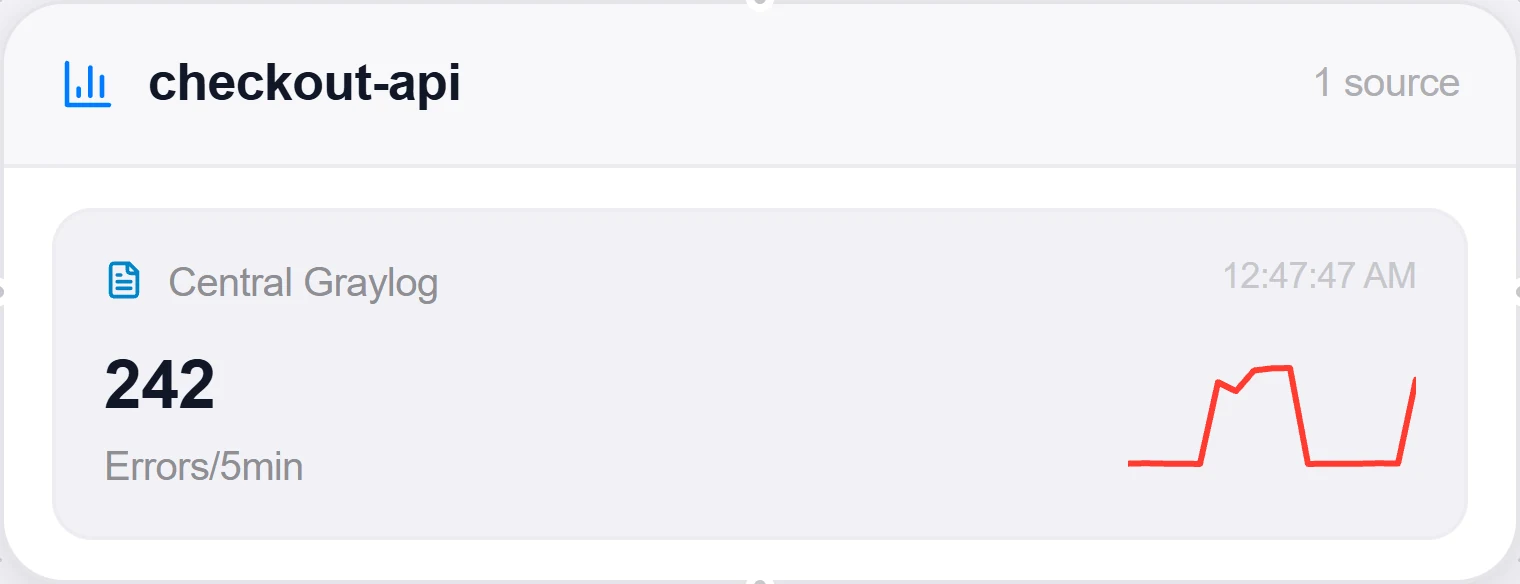
- SaveSet the interval and click Add Source. The card charts the matching-message count per window — an error storm is a spike you can threshold and alert on.
3 · Beyond presets: custom queries & the All-Services alarm
Custom Query
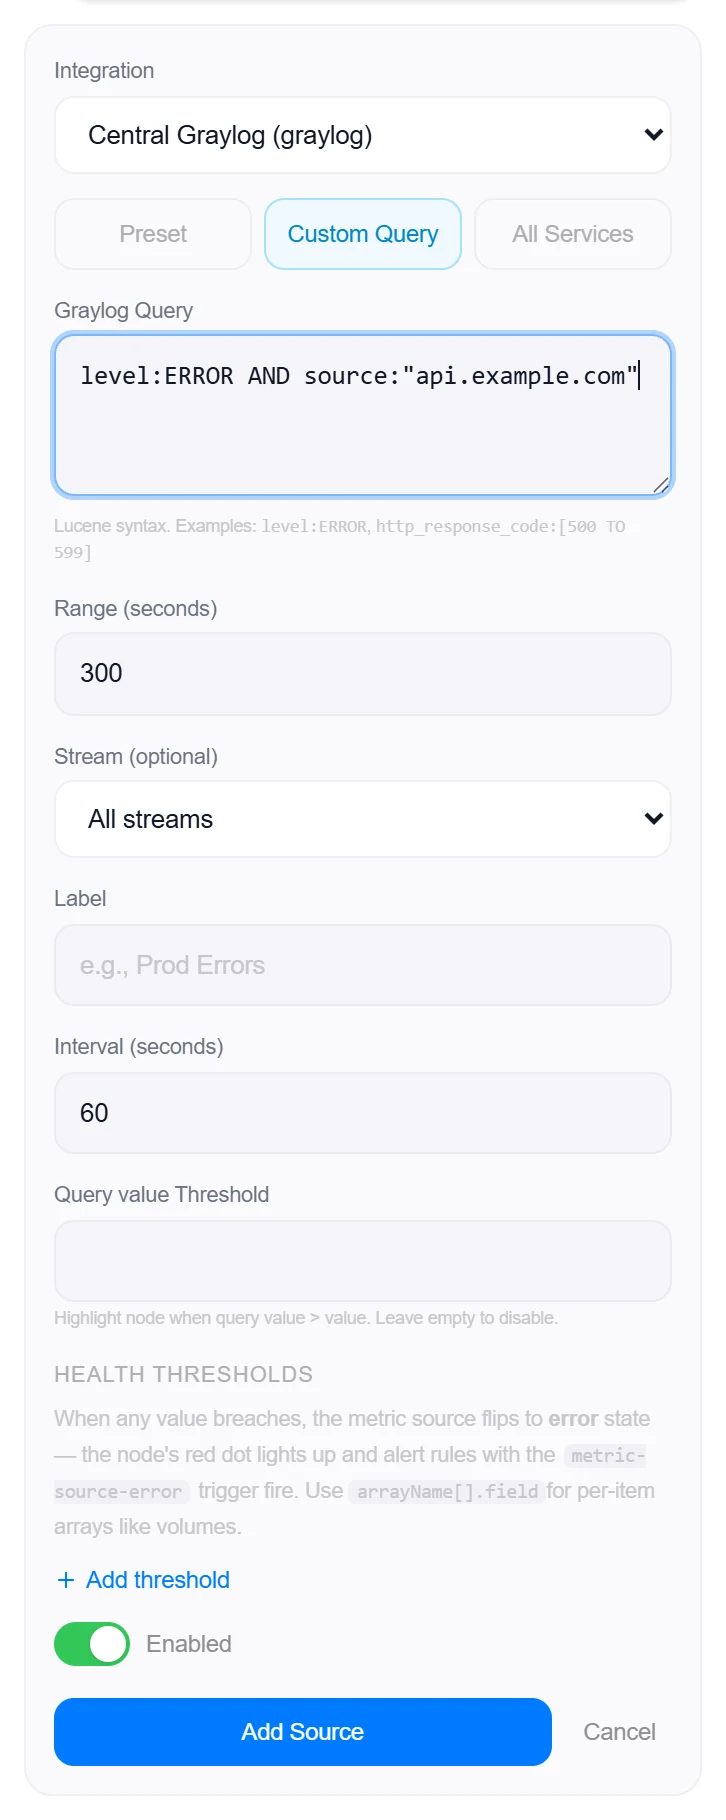
Count any log pattern: the same Lucene syntax as the Graylog search bar, optionally scoped to a stream. The card charts the number of matching messages per window.
- The range window defaults to 300 s; left unset it follows the polling interval, so counts don’t drift when you poll faster than the window.
- Graylog errors surface with their real message — typically a field-type mismatch, like searching a string against a numeric field.
All Services
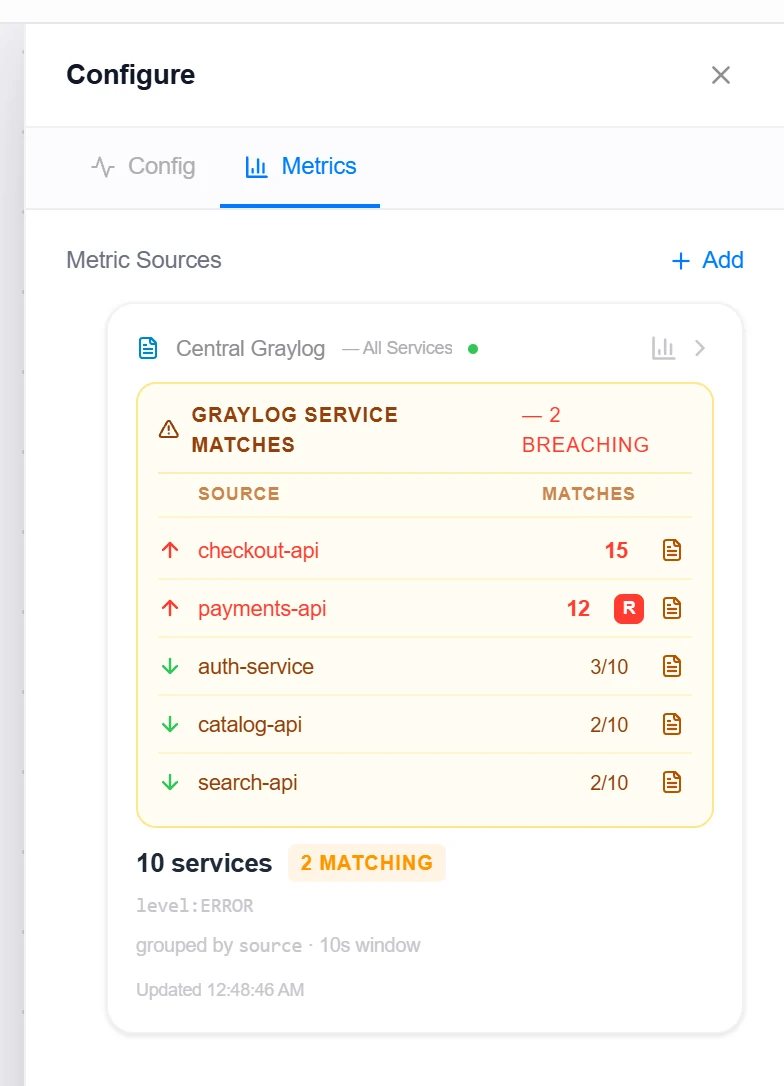
One query fanned out across every service in your logs, alerting on each service’s deviation from its usual error count rather than on every error. Each check asks Graylog for exact per-service counts in one aggregation (a Views values pivot on a group field — default source, picked from your integration’s discovered fields), and a service seen in the last 24 hours that logged nothing this check reads a measured 0 instead of dropping off the list.
- When Graylog cannot aggregate, the source steps down: a pivot by service and error type → a pivot by service only (error types then come from fingerprints) → counting the newest matching messages (Advanced → Fallback cap, 500). On that last step the card says the counts are sampled and why — busy services are undercounted, quiet ones are not listed, no zeros are recorded, and a count at the cap gets no verdict. A refused aggregation is not retried for 10 minutes.
- Error types: with an Error type field (e.g.
exception_class; common names are badged Suggested) each service’s errors are counted per type, up to 10 types a check. Without one — or for messages that lack the field — types are fingerprints of the sampled messages (Advanced → Sample size, 150), scaled to the service’s count and marked approx / “sampled”. Up to 50 named types per service are kept; the rest, and anything untyped, count as(other). - Alarm rule: Baseline (the default) or Count threshold — the old rule, where any service above N matches in one check breaches (0 = any match). Baseline knobs: Times the usual (3, 1.5–20), Minimum excess (10 errors, 0–10000), Breach on N of the last M checks (2 of 3, M ≤ 30) and Clean checks to clear (10).
- What is usual is per service, for this weekday and hour. Until that hour has 3 weeks of history it is a provisional baseline — the mean of the same hour yesterday and the last 24 hours, from the hourly rollups — and before 3 hourly buckets exist the service shows learning · N h and gets no verdict. Once the weekday × hour cell is ready (Admin → Baseline minimum weeks, 3) the seasonal expectation takes over by itself.
- When it alerts: a check is over when a service’s errors are at least ratio × the usual and at least the minimum excess above it — the alarm line is the larger of the two (usual 5, ×3, +10 → alarm above 15). On the seasonal baseline the count must also be above that hour’s usual spread. Two over checks in the last three open the breach. Once the count is back below ¾ of the line the row goes breached → clearing → resolved: the card shows clearing n/10 and the breach resolves after the Clean checks to clear count (10 by default) of clean checks. A single over check while clearing holds the count; a confirmed one re-breaches the same row, without a new toast.
- A breach reads transfer: 40 errors in 60 s, 8× the usual 5 (alarm above 15) for Tue 14:00 (TimeoutException ×30, …), with “(provisional baseline)” while it is. It shows as a toast, in the Log errors above baseline banner (with a Usual column) and on the Alerts page as transfer · log errors · <source> with the figure Log errors 40 · limit 15. Alert channels hear it only through an alert rule with the log-error baseline trigger (see the Alerting guide).
- New error types (on by default; Warn on a new error type): a type the service has not logged for 7 days raises one warning toast — payments: new error type TimeoutException (×140), “, sampled” for a fingerprint. The first time a service is seen its types are recorded silently, and
(other)is never new. Mute 24 h on the toast quiets that type for that service for a day. A type from the error type field is new at first sight; a sampled type (a fingerprint of the sampled messages) only once it is seen in 2 of the last 3 checks of its service (Admin → Log error types: checks to confirm a sampled type, 1–3; 1 = at first sight) — a single sampled line is not a warning, and until confirmed its count is under(other). A service whose sampled messages form Noisy service threshold (25 by default, 0–500; 0 = never) distinct error families in 24 hours is noisy: its sampled new-type warnings pause and the panel card and the Catalogue show an amber noisy chip — set an error type field or narrow the query instead. A new error type recovers once it is not seen for an hour (Admin → Alerts); a sampled one after 6 hours at least, and it does not reopen when the sample catches it again. - The node tile reads 12 services · 2 above alarm line (worst transfer 8×) · 1 new error type; none above alarm line when services logged errors in this check but none crossed its line; All quiet only when no service logged an error in this check; or learning. Its hover adds “sampled counts” or “provisional baseline”. The panel card's header says what it counts — 106 services · 11 erroring now · 84 had errors in 24 h · 11 quiet — and ranks the services by × the usual: Service · Errors · Usual · × · a 24 h sparkline · the top 3 types · badges (provisional, learning, approx, new) · Ack · View logs — the top 12, then Show all. On a narrow card (under 480 px — the inspector, a canvas node) each row stacks instead: the name with Ack / View logs, then 4 errors · usual 1.5 · 2.7× usual, then its type chips.
- The node keeps its colour on a baseline breach; tick Also colour the node red while a service is alerting to add that health rule.
- Upgrading: every existing All Services source without a match threshold switched to Baseline once (its old any-match breaches closed as “rule changed to baseline”); a source with a non-zero threshold stays on Count threshold, and its form offers a one-click switch.
- The service count uses a wider one-hour window, so quiet-but-healthy services still count toward “N services”.
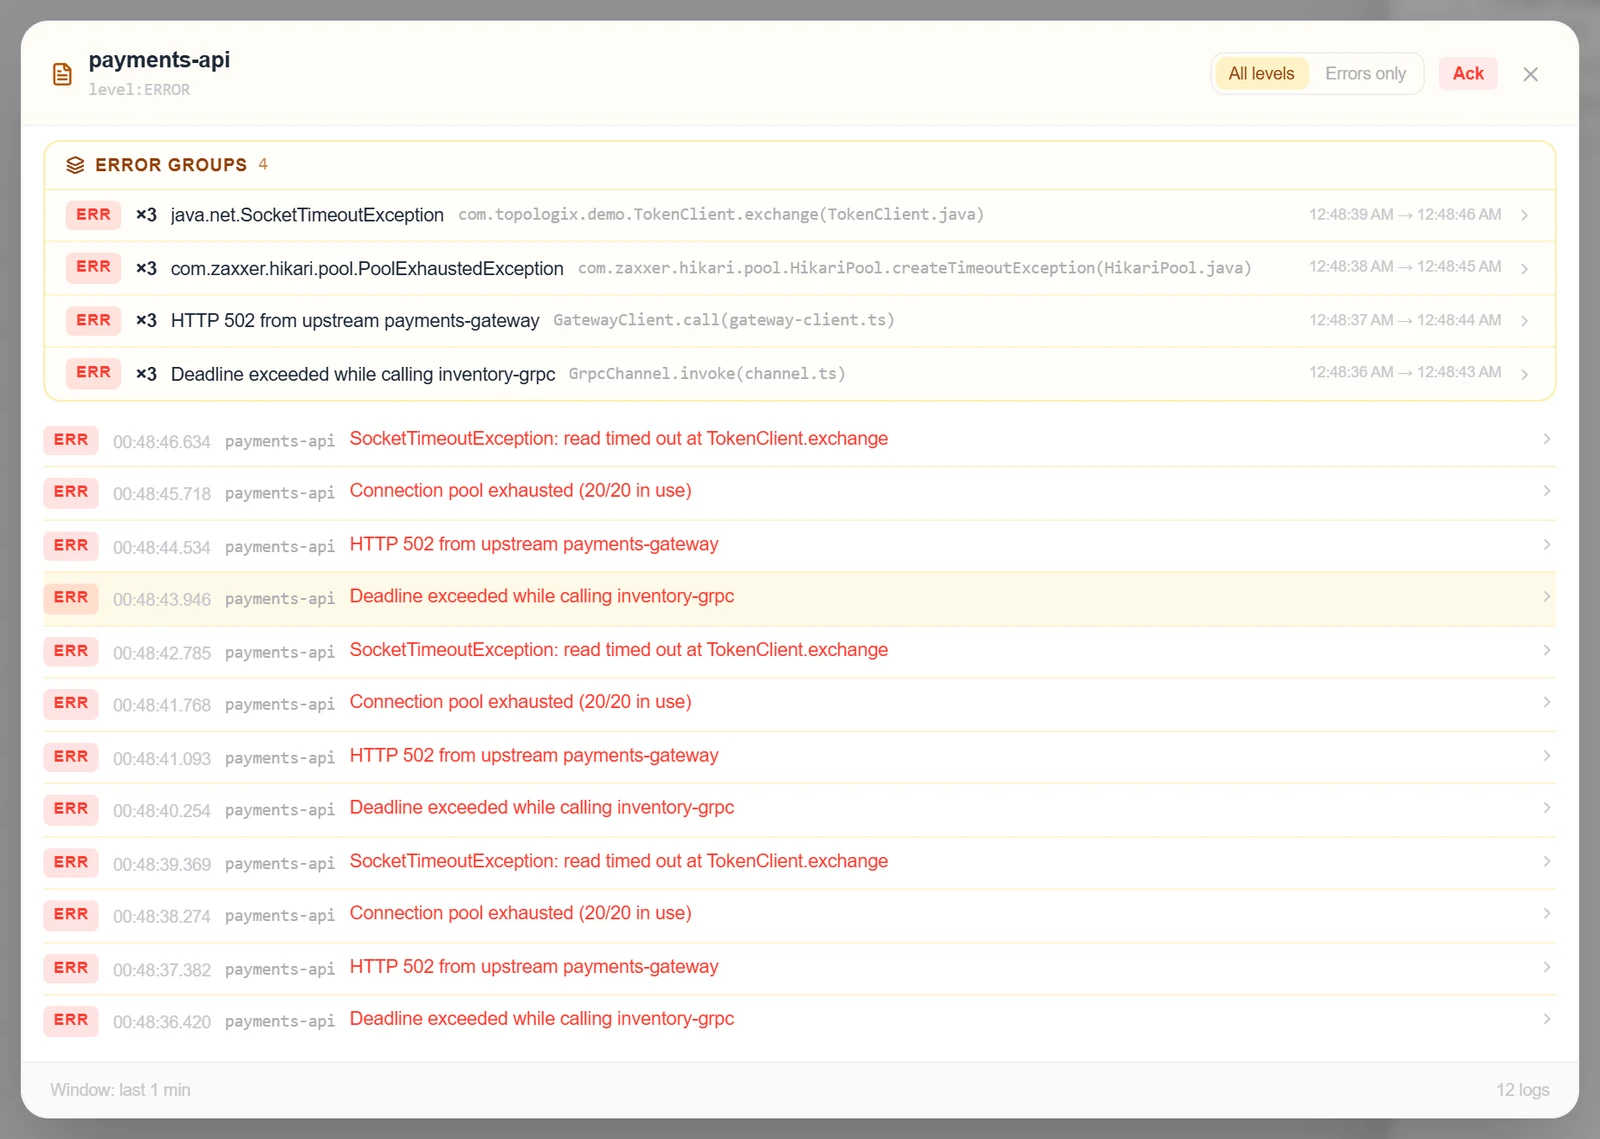
- “View logs” keeps the latest matching lines per service, and the source can hand them to the local-AI post-mortem or RECAP incident correlation.
Good to know
- On error spikes, the AI log analysis can pull up to 200 grouped log lines from the same integration and produce a post-mortem.
- An All Services source makes 3 Graylog calls per check — the aggregation, a 150-line sample (error types and the log viewer) and the fleet count — one more than before exact counts.
- A source polled through a proxy needs proxy 1.215.0 or newer for exact counts, zeros and baselines; an older proxy’s counts are treated as a sample and the card asks you to update it.
- The Catalogue service page has a Logs section: the service’s errors over 7 days, a 24 h hourly trend against the usual line, and its error types with count, first and last seen, a new marker (first seen in the last 24 hours, not while the service was first being recorded) and a sampled marker, plus Open log viewer. Types are written every 5 minutes (Admin → Log error types: flush interval, types kept per service, checks to confirm a sampled type, retention 30 days, hourly buckets 14 days), so it fills a few minutes after the first check.
- A baseline needs a rollup series per service: past Rollup series per source (128; 12 on the built-in SQLite store) further services are counted but get no baseline — raise it for bigger fleets.
More Monitoring & Observability integrations
See it on your own infrastructure
Book a demo and we will walk you through Topologix with your systems in mind: on our cloud, or self-hosted in your own network.