Prometheus monitoring with Topologix
Monitoring & Observability
Connect any Prometheus-compatible HTTP API — Prometheus itself, VictoriaMetrics, Thanos, Mimir — and chart the result of any PromQL query on a node, or run an All-Services latency alarm across every service a query returns.
Requirements
- Network reach from the Topologix server (or a proxy agent) to the Prometheus HTTP API port (default 9090).
- No credentials — Topologix does not send Basic auth to Prometheus. If your instance sits behind auth, front it with a reverse proxy that strips the header or route through a Topologix proxy agent on the same network.
1 · Set up the integration
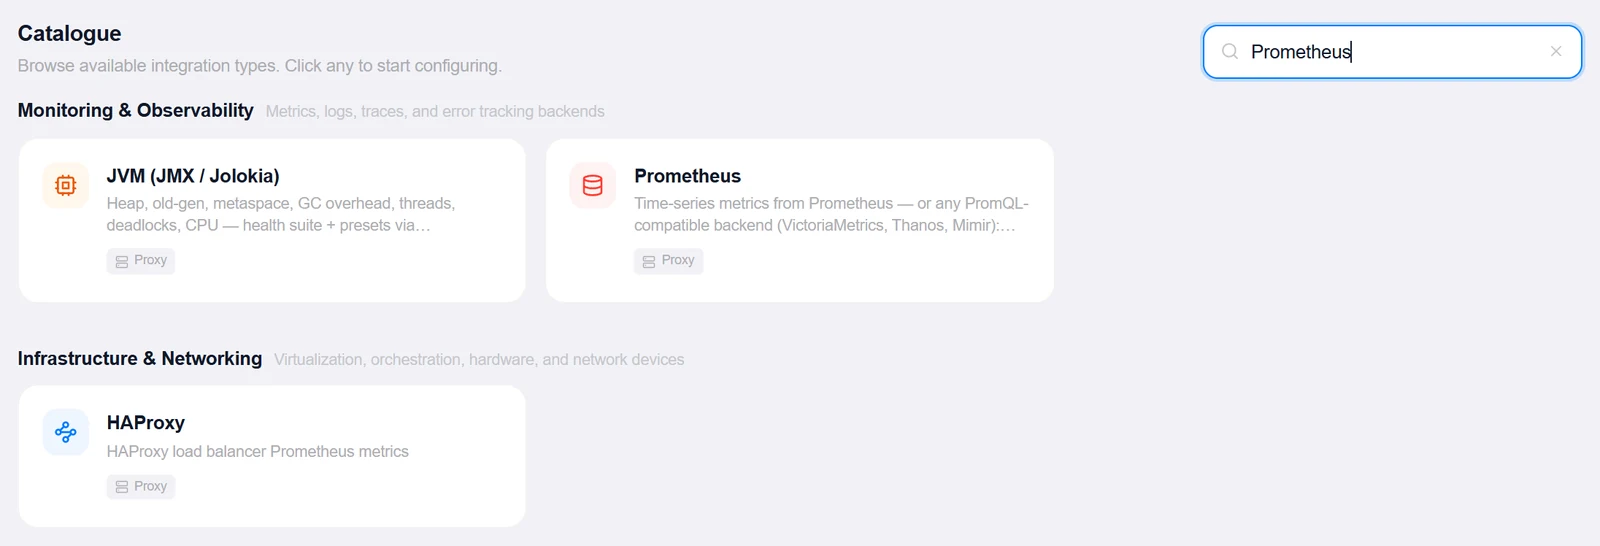
- Open the Integrations pageClick Integrations in the toolbar, then find Prometheus in the catalogue (the search box narrows it instantly).
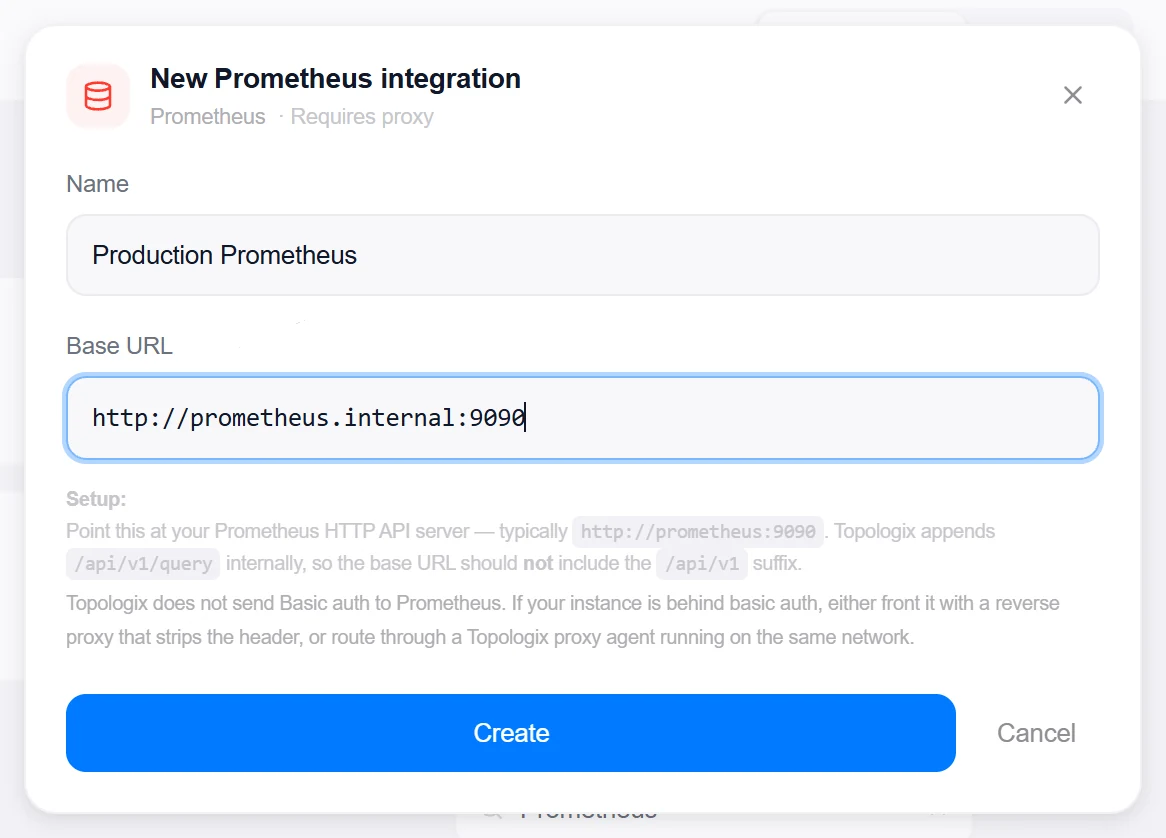
- Enter the base URLPoint it at the Prometheus HTTP API — typically
http://prometheus:9090. Topologix appends/api/v1/queryinternally, so do not include the/api/v1suffix. - Pick a default proxy (optional)If the server can’t reach Prometheus directly, choose a proxy agent running inside that network. Each metric source can override this later.
- Create, then verifyClick Create, then reopen the integration and click Test on the configured card to verify connectivity.
Target on a private network? Route it through a proxy agent. Proxy agents run inside your network — behind NAT, on a management VLAN, in an air-gapped segment — and reach targets the Topologix server can't. The agent polls the server every 15 seconds for its assignments, runs the checks locally, and pushes results back every 5 seconds, so no inbound firewall rules are ever needed. Set a default proxy on the integration; every metric source can override it. If a proxy goes offline, its sources are marked stale within ~90 seconds and the last known values stay visible.
2 · Add it to a flow
- Select a nodeOpen your flow, click the node that should carry the metric, and open the Metrics tab in the Configure panel.
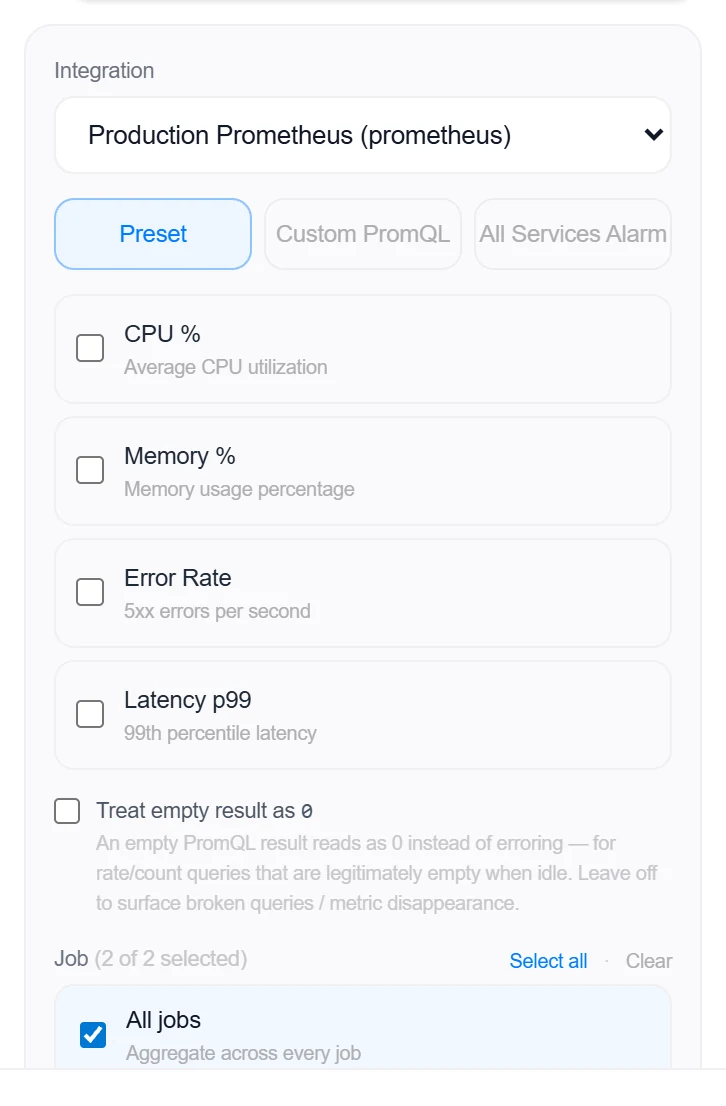
- Add a sourceClick + Add, choose your Prometheus integration, then pick a mode: Preset (CPU %, Memory %, Error Rate, Latency p99), Custom PromQL for any query, or All Services Alarm to watch every service a query returns.
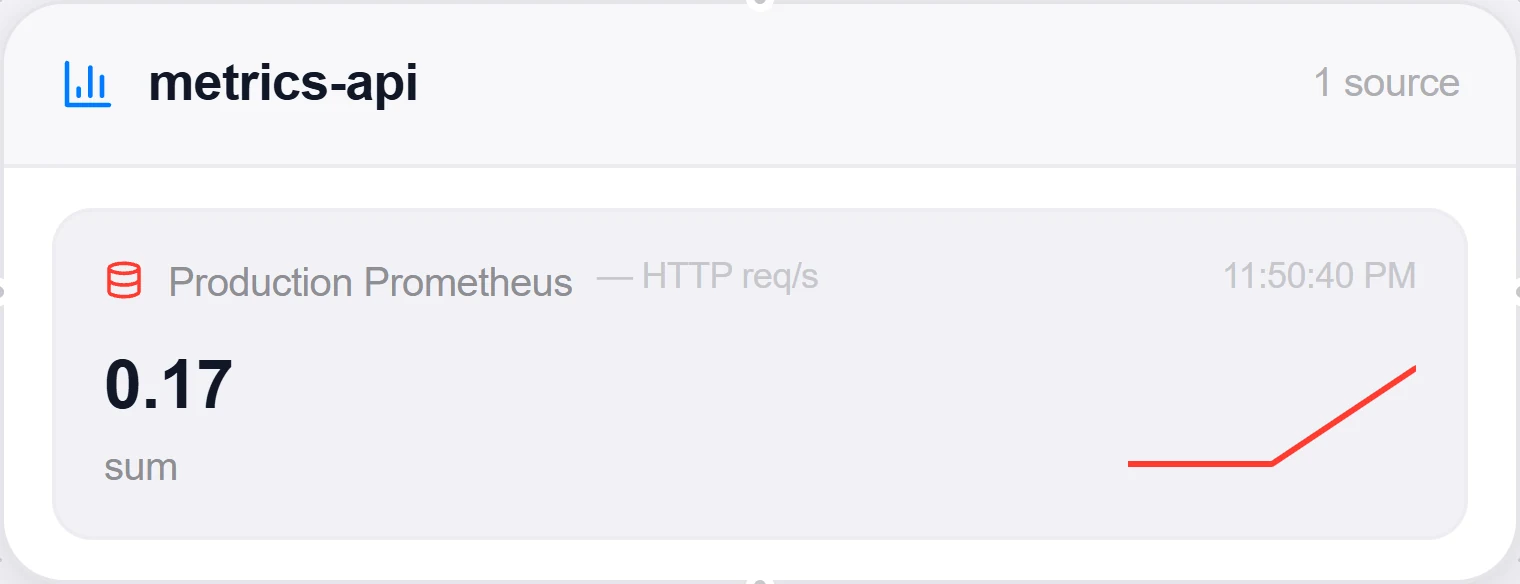
- Scope and saveOptionally scope to specific jobs, set the polling interval (10s floor), add a threshold, and click Add Source. The first value lands within a second; the sparkline builds as history accumulates.
3 · Beyond presets: custom queries & the All-Services alarm
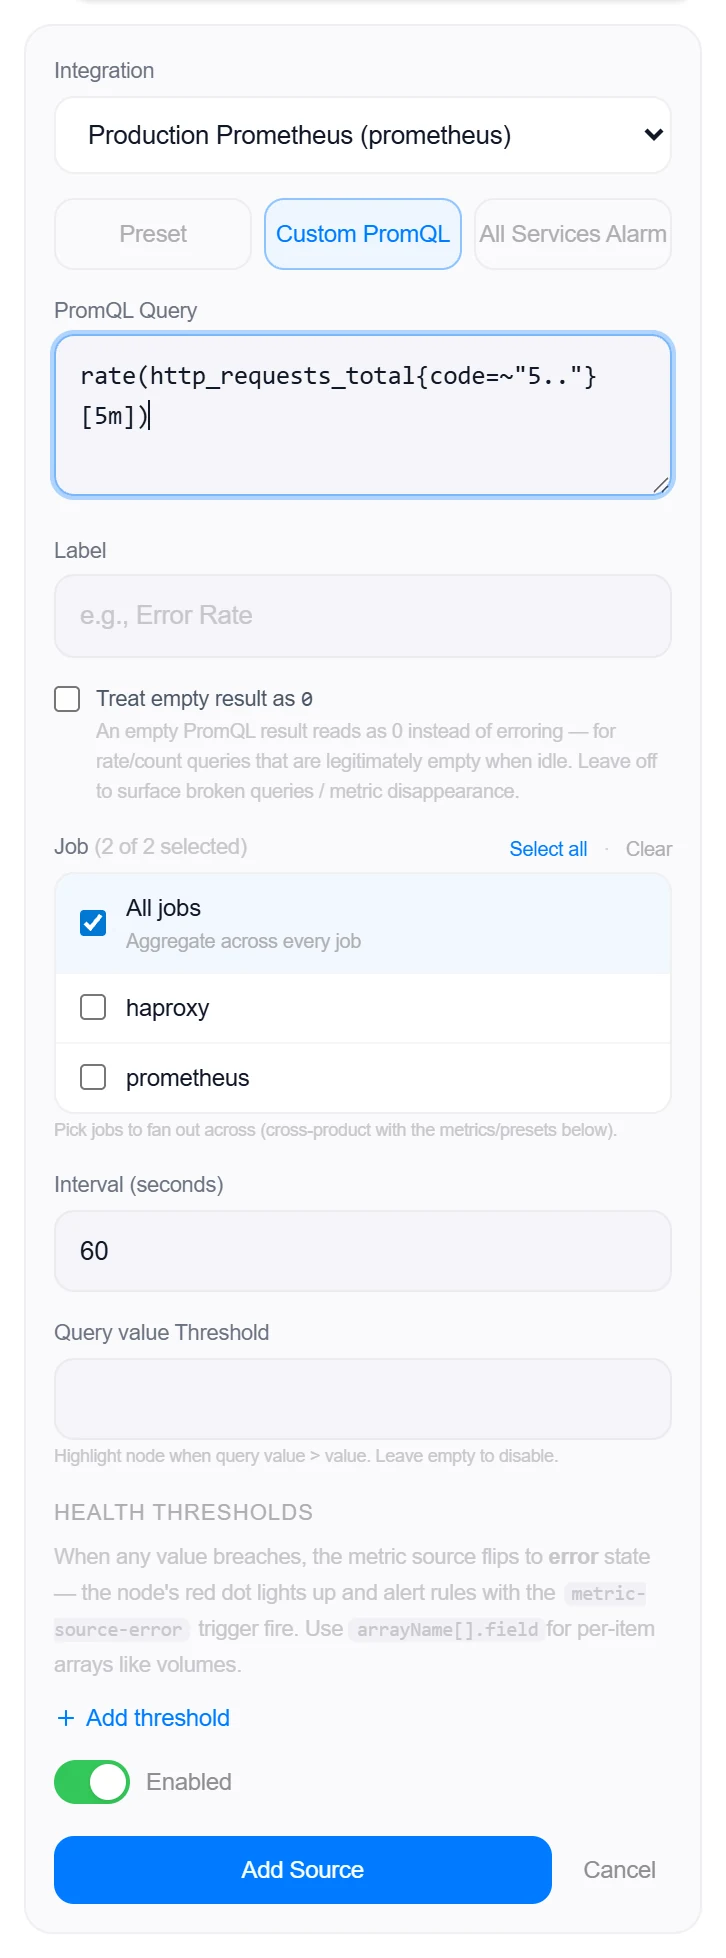
Custom PromQL
Chart the result of any PromQL query that returns an instant vector — the first series’ value lands on the card each poll.
- Scope custom queries inside the PromQL itself (e.g.
{job="api"}) — the job picker applies to presets. - Tick Treat empty result as 0 for rate/count queries that are legitimately empty when idle; leave it off so broken queries and disappearing metrics surface as errors.
All Services Alarm
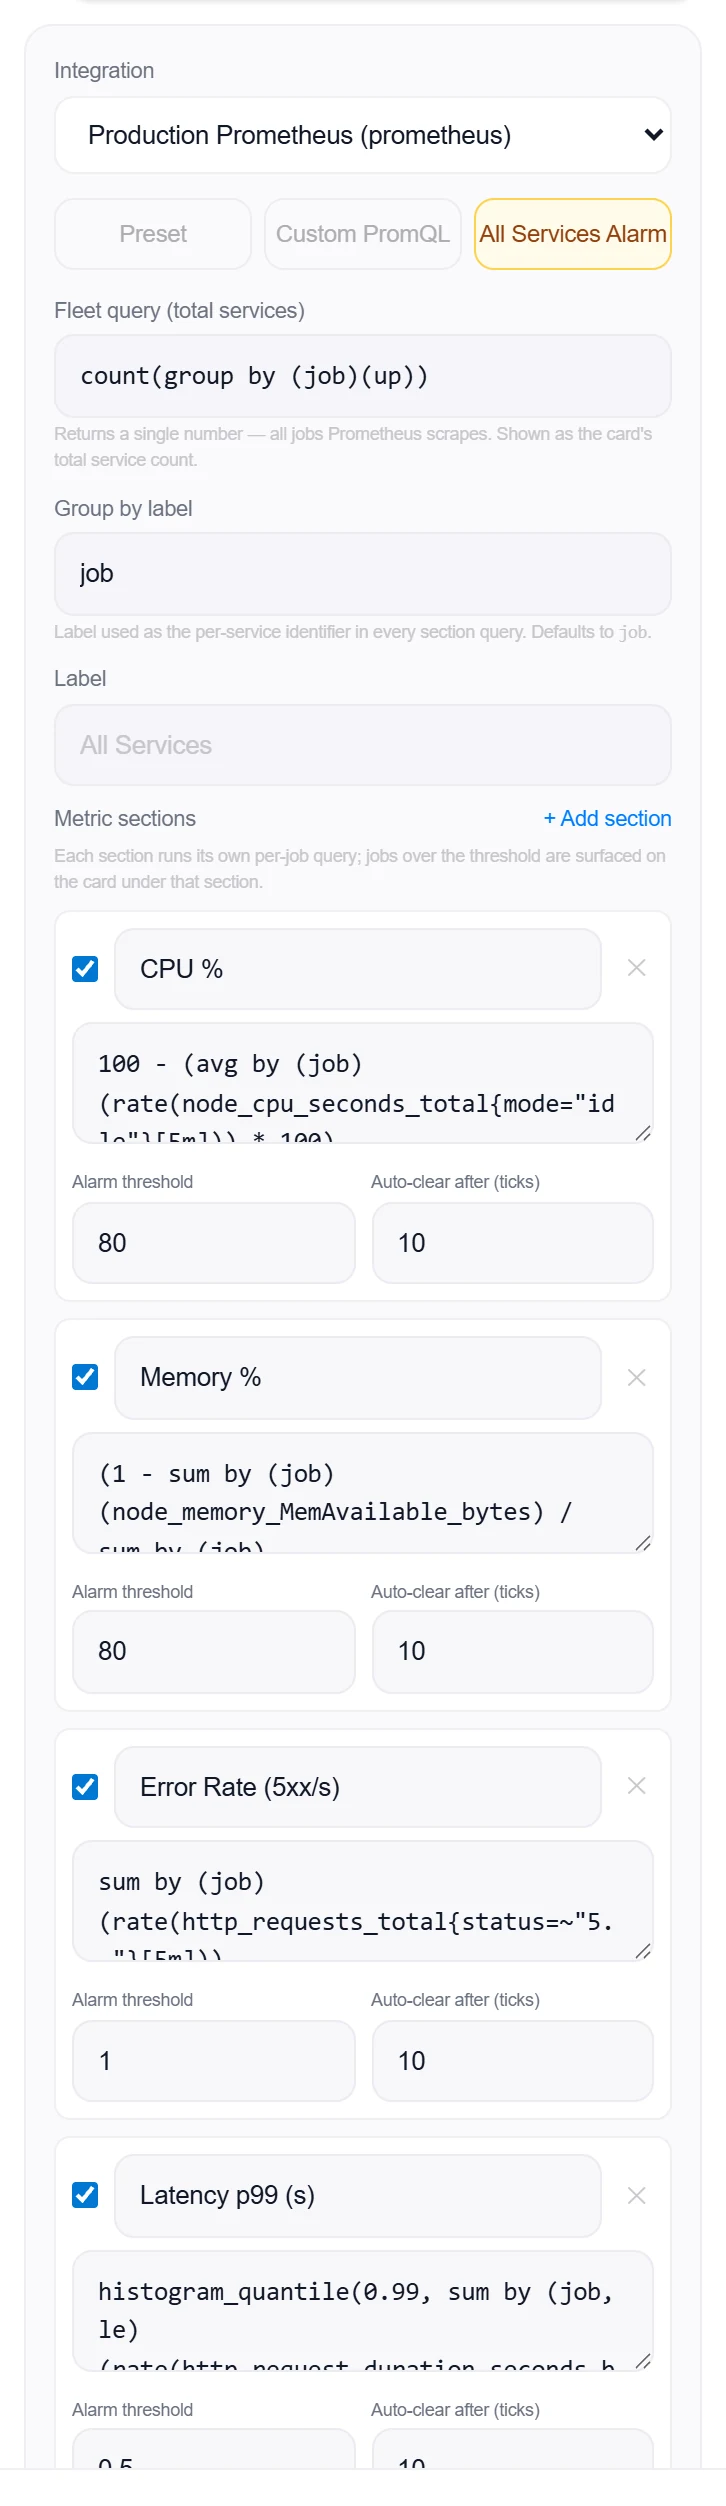
One source that watches the whole fleet. A fleet query counts your services (default count(group by (job)(up))), and each section — CPU %, Memory %, Error Rate and Latency p99 come pre-configured — runs its own per-job query with its own threshold.
- Every service a section returns gets independent breach state: a fresh breach raises one alert for that service and section; acknowledging mutes it without hiding it.
- Breach state auto-clears after sustained clean polls (default 10), and services that disappear from results age out — no ghost rows.
- The card shows “N services · M breaching” with a per-section status row; one broken section query never blanks the card.
More Monitoring & Observability integrations
See it on your own infrastructure
Book a demo and we will walk you through Topologix with your systems in mind: on our cloud, or self-hosted in your own network.