Vutlan monitoring with Topologix
Infrastructure & Networking
Vutlan (VT/SC-series) environmental monitoring — temperature, humidity, water leak, smoke/fire, door contacts, power, voltage, and airflow elements read from the unit’s HTTP JSON API. Credentials live on the integration; each unit is a metric source addressed by host, polled through the on-prem proxy.
Requirements
- A Vutlan monitoring unit with its HTTP JSON API reachable — the fetcher auto-probes the known endpoints (
/api/data,/data.json,/rest/sensors, …). Username/password or an API token are optional. - HTTP(S) reach from a proxy agent on the device’s network; plain HTTP is the default transport.
1 · Set up the integration
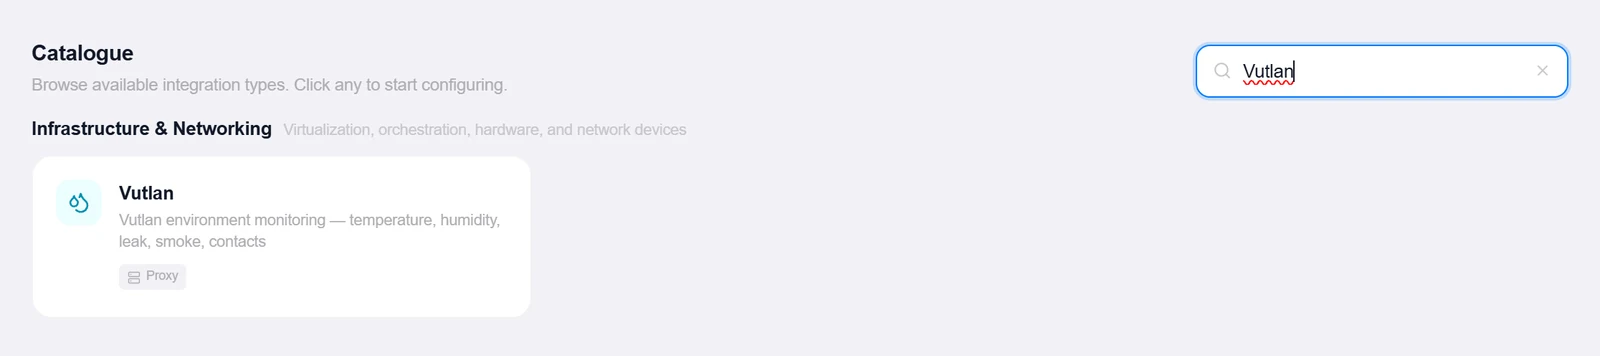
- Open the Integrations pageClick Integrations in the toolbar and pick Vutlan from the catalogue.
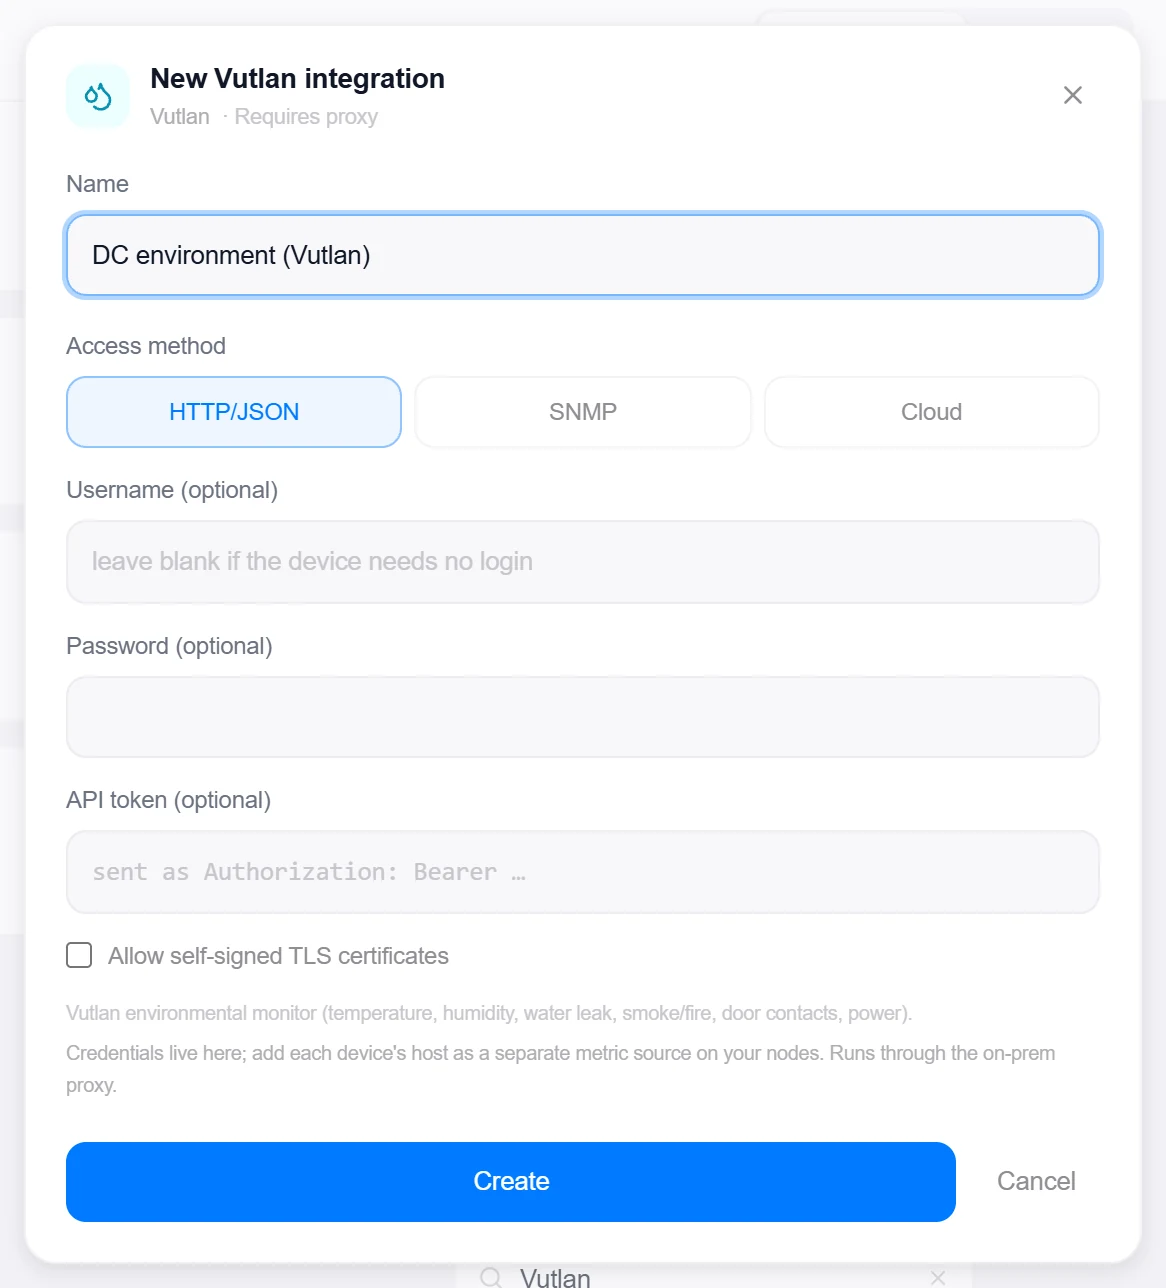
- Choose the access method and credentialsHTTP/JSON is the implemented path (SNMP and Cloud are scaffolded but not yet implemented). Optional Username/Password, an optional API token (sent as
Authorization: Bearer), and an Allow self-signed TLS certificates toggle. - Create, then verifyClick Create, then reopen the integration, enter any unit’s IP under Test device host, and click Test — it probes the known endpoints and reports the model plus how many sensor elements it parsed. The test host isn’t saved.
Target on a private network? Route it through a proxy agent. Proxy agents run inside your network — behind NAT, on a management VLAN, in an air-gapped segment — and reach targets the Topologix server can't. The agent polls the server every 15 seconds for its assignments, runs the checks locally, and pushes results back every 5 seconds, so no inbound firewall rules are ever needed. Set a default proxy on the integration; every metric source can override it. If a proxy goes offline, its sources are marked stale within ~90 seconds and the last known values stay visible.
2 · Add it to a flow
- Select the room or rack nodeClick the node, open Metrics, then + Add and choose the Vutlan integration. Enter this unit’s Device host.
- Discover and pick sensorsDiscover sensors lists the unit’s elements grouped by category — leave none selected to track them all. An optional Card pill sensor shows one reading as the colored value on the node card and the rack U-bar.
- SaveSet the interval and click Add Source. The card headlines max temperature and humidity, banners leak and smoke/fire alarms in red, and lists every element by category; any Critical element turns the source red.
Live canvas screenshots for this integration require a real Vutlan environment, so this guide shows the configuration screens only — the flow steps above work exactly like every other integration.
Good to know
- Vutlan elements carry a vendor
typethat maps directly onto categories (dry_switch→contact,water→leak,relay/mains→power, …); anything unrecognized falls back to label-keyword guessing. - The parser handles several firmware response shapes — an elements/sensors array or an object keyed by element id — so Test’s parsed-sensor count is the quick way to validate your unit’s firmware.
More Infrastructure & Networking integrations
See it on your own infrastructure
Book a demo and we will walk you through Topologix with your systems in mind: on our cloud, or self-hosted in your own network.