Zigbee (SLZB-06) monitoring with Topologix
Infrastructure & Networking
A local Zigbee sensor mesh with no internet, no MQTT broker, and no Zigbee2MQTT — the proxy owns the coordinator radio in a dedicated SLZB-06 ethernet gateway via an embedded zigbee-herdsman controller, and paired sensors’ reports (temperature, humidity, pressure, motion, contact, leak, smoke, battery, link quality) land on the shared environment card.
Requirements
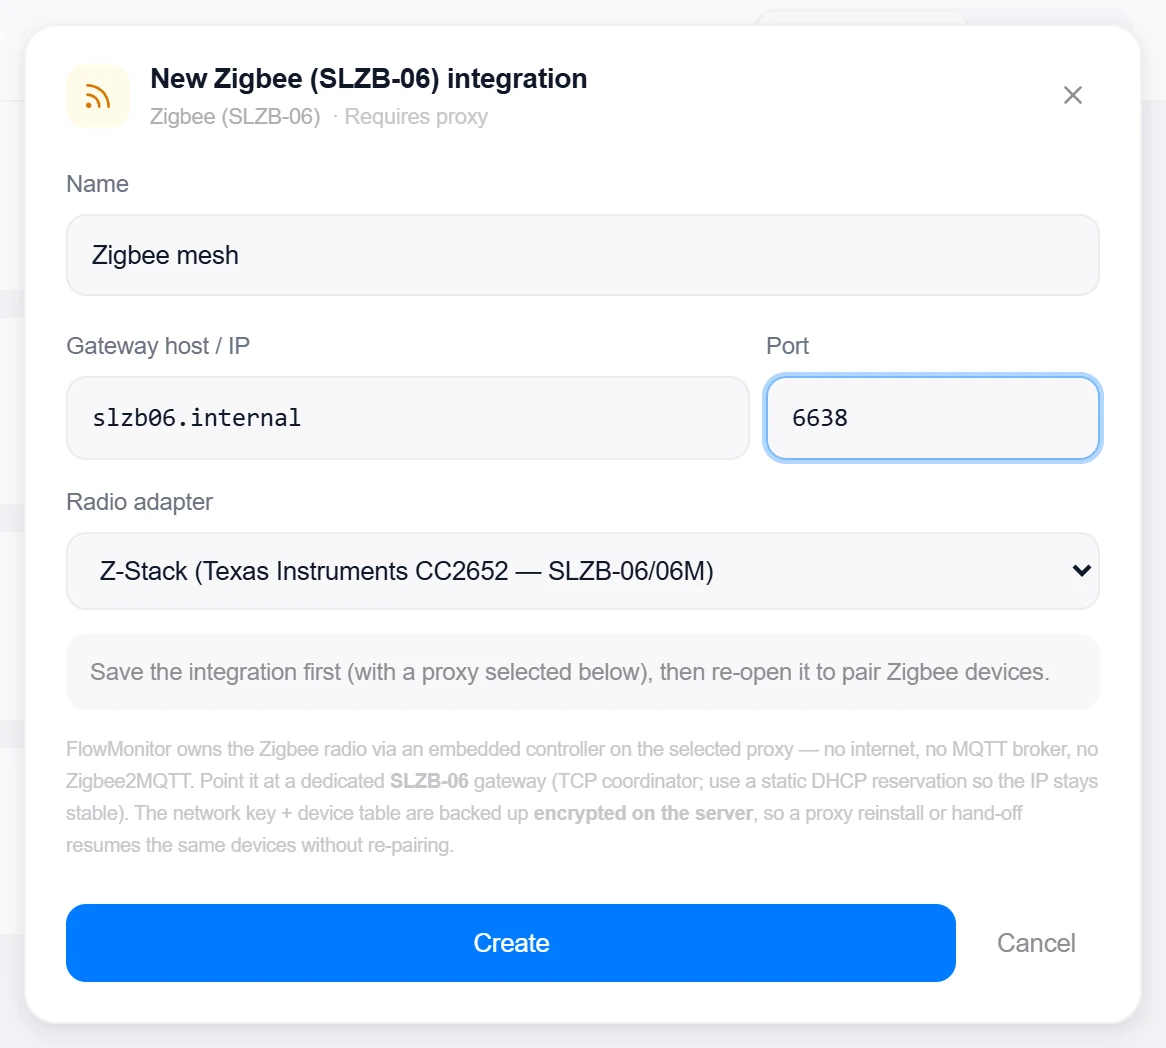
- A dedicated SLZB-06-family gateway reachable over TCP (default port 6638) with a static DHCP reservation — Topologix owns the radio, so it can’t be shared with Zigbee2MQTT or Home Assistant.
- A proxy agent on the gateway’s network — Zigbee sources must run on a proxy (the embedded controller drives the radio; the cloud server can’t).
zigbee-herdsmanships with the proxy as an optional dependency.
1 · Set up the integration
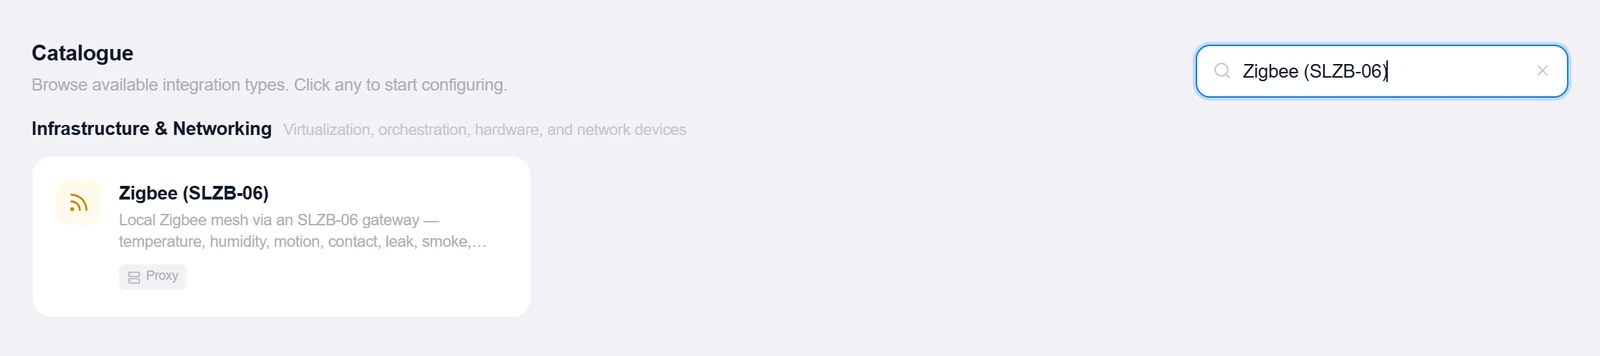
- Open the Integrations pageClick Integrations in the toolbar and pick Zigbee (SLZB-06) from the catalogue.
- Point it at the gatewayGateway host / IP and Port, plus the Radio adapter: Z-Stack (Texas Instruments CC2652 — SLZB-06/06M) or EmberZNet (Silicon Labs EFR32 — SLZB-06P7/P10). Save with a proxy selected — pairing controls appear on re-open.
- Pair devicesPermit join opens the network for the chosen window (default 120 s); put each sensor in pairing mode and it appears in the device list, where you can rename it.
Target on a private network? Route it through a proxy agent. Proxy agents run inside your network — behind NAT, on a management VLAN, in an air-gapped segment — and reach targets the Topologix server can't. The agent polls the server every 15 seconds for its assignments, runs the checks locally, and pushes results back every 5 seconds, so no inbound firewall rules are ever needed. Set a default proxy on the integration; every metric source can override it. If a proxy goes offline, its sources are marked stale within ~90 seconds and the last known values stay visible.
2 · Add it to a flow
- Select the nodeClick the node, open Metrics, then + Add and choose the Zigbee integration.
- Pick the paired deviceA dropdown lists the mesh’s paired devices by name and model id — one source per device; all of its sensors are tracked.
- SaveSet the interval and click Add Source. The card headlines max temperature and humidity, banners leak and smoke alarms, shows contact and motion state and battery — and link quality rides along as a diagnostic (LQI below 20 warns).
Live canvas screenshots for this integration require a real Zigbee (SLZB-06) environment, so this guide shows the configuration screens only — the flow steps above work exactly like every other integration.
Good to know
- Reads are push-based: battery sensors report on their own cadence, each poll returns the latest cached values, and a device unheard from for 6 hours is treated as offline.
- The network key and device table are backed up encrypted on the server — a proxy reinstall or hand-off resumes the same mesh without re-pairing, and a single-owner lease guarantees only one proxy drives the radio.
- Batteries warn at 20% and go critical at 10%; IAS-zone alarms are classified by the device’s zone type (contact, motion, water leak, smoke).
More Infrastructure & Networking integrations
See it on your own infrastructure
Book a demo and we will walk you through Topologix with your systems in mind: on our cloud, or self-hosted in your own network.