HAProxy monitoring with Topologix
Infrastructure & Networking
Load-balancer health from HAProxy’s built-in Prometheus exporter — backend and server up/down state, request and error rates, queueing, DNS resolver activity, and backend SSL certificate expiry, aggregated from one /metrics scrape per poll.
Requirements
- The Prometheus exporter enabled in
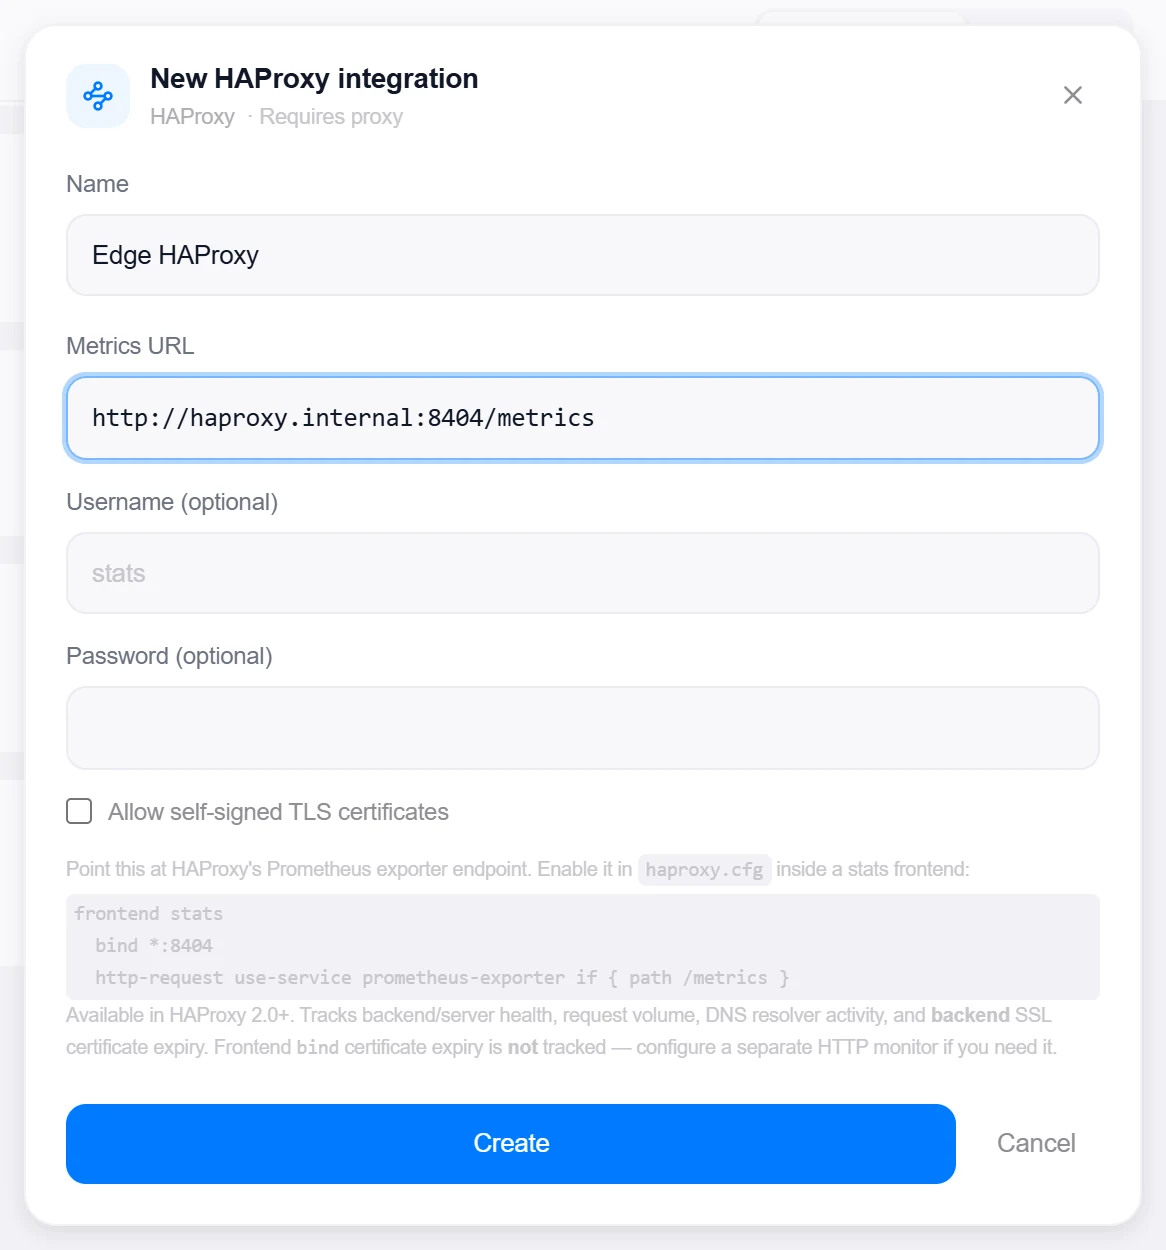
haproxy.cfg(HAProxy 2.0+): a stats frontend withhttp-request use-service prometheus-exporter if { path /metrics }, typically on port 8404. - HTTP(S) reach from the Topologix server or a proxy agent to that port; optional Basic auth if the stats frontend requires it.
1 · Set up the integration
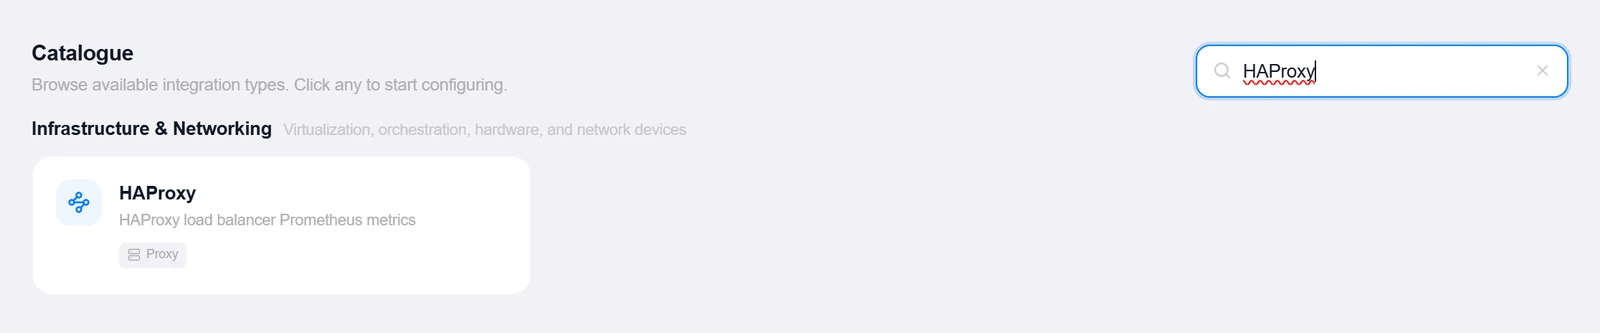
- Open the Integrations pageClick Integrations in the toolbar and pick HAProxy from the catalogue.
- Enter the metrics URLThe full exporter path —
http://haproxy.internal:8404/metrics, not just the host. Optional Username/Password for a protected stats frontend, and an Allow self-signed TLS certificates toggle. - Create, then verifyClick Create, then reopen the integration and click Test — it verifies the endpoint actually serves HAProxy metrics (not just any web page) and reports the version plus frontend/backend/server counts, so you know you hit the right instance.
Target on a private network? Route it through a proxy agent. Proxy agents run inside your network — behind NAT, on a management VLAN, in an air-gapped segment — and reach targets the Topologix server can't. The agent polls the server every 15 seconds for its assignments, runs the checks locally, and pushes results back every 5 seconds, so no inbound firewall rules are ever needed. Set a default proxy on the integration; every metric source can override it. If a proxy goes offline, its sources are marked stale within ~90 seconds and the last known values stay visible.
2 · Add it to a flow
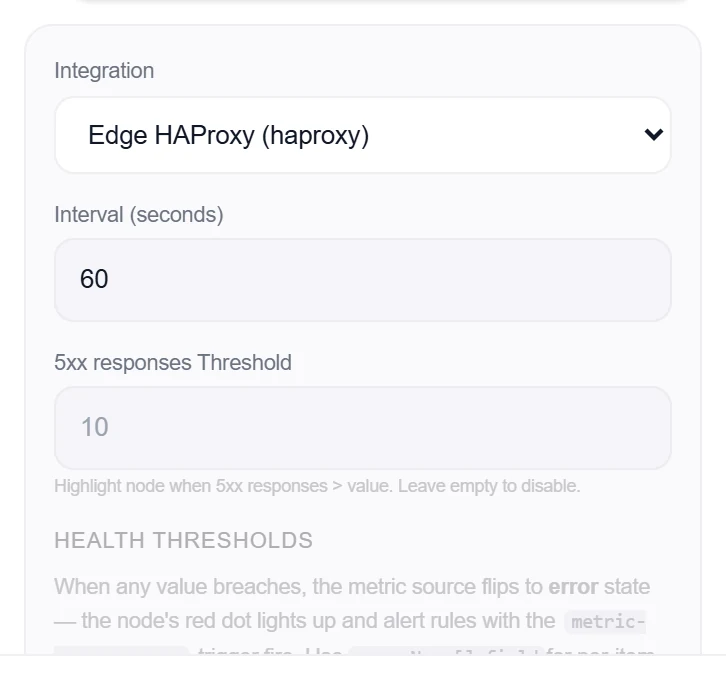
- Select the load-balancer nodeClick the node, open Metrics, then + Add and choose the HAProxy integration.
- Add the sourceNo per-type options — one source covers the whole HAProxy process: every frontend, backend, and server it knows.
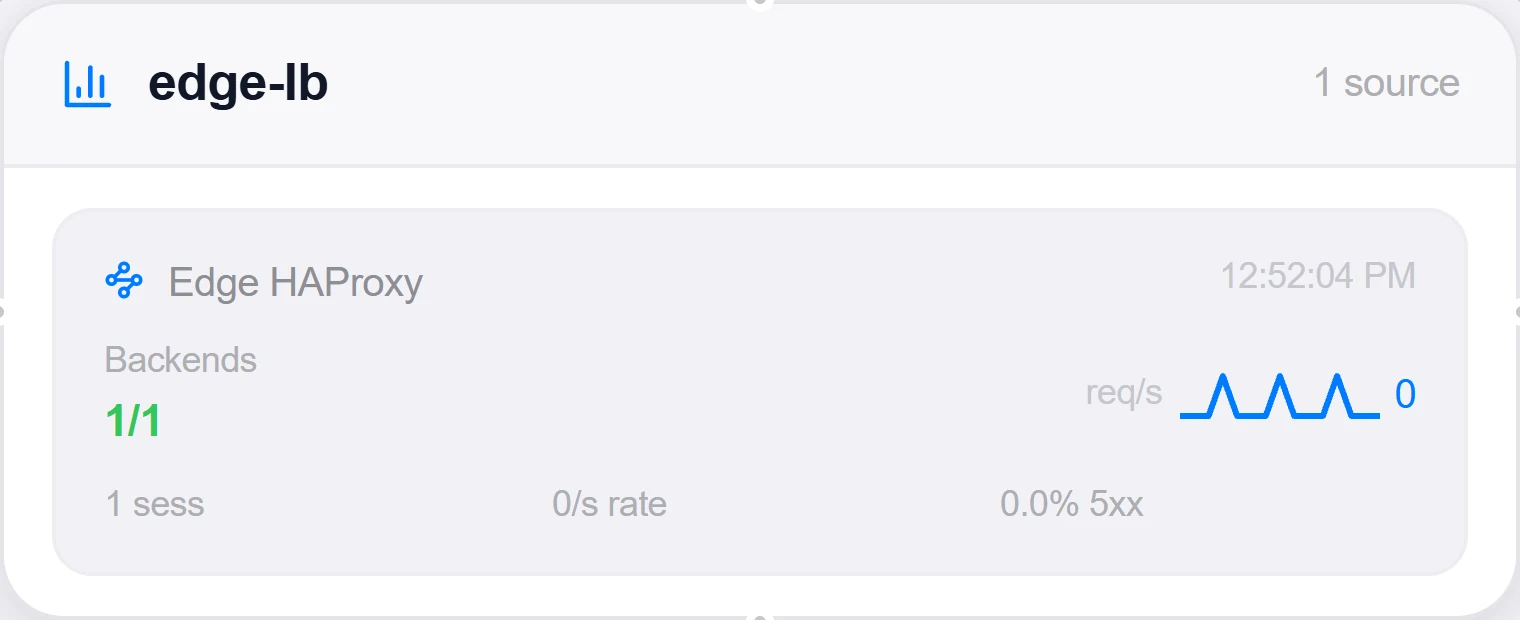
- SaveSet the interval and click Add Source. The card shows backends up/down, sessions, per-second request and 5xx/error rates, and worst-backend rollups (max 5xx/s, deepest queue, slowest response) for picker-free alerting.
Good to know
- Request and error rates are counter deltas between polls — the first sample shows no rate, every later one is a true per-second figure that survives HAProxy reloads.
- Backend SSL certificate expiry is tracked (with an expiring-soon window); frontend
bindcertificates are not exposed by the exporter — add a separate HTTP monitor for those. - The scrape is capped at 10 seconds so a wedged HAProxy under load can’t pile up the polling queue.
More Infrastructure & Networking integrations
See it on your own infrastructure
Book a demo and we will walk you through Topologix with your systems in mind: on our cloud, or self-hosted in your own network.