Kubernetes monitoring with Topologix
Infrastructure & Networking
Cluster and namespace health straight from the Kubernetes API — node readiness, pod counts, and metrics-server resource usage, plus a cluster-scope problem detector that surfaces CrashLoopBackOff, OOMKilled, image-pull errors, stuck Pending, NotReady, and high-restart pods with a per-pod events drill-in.
Requirements
- A ServiceAccount bearer token with cluster-read RBAC — get/list on
nodes,pods,namespaces, andservices, plus themetrics.k8s.iogroup for resource usage, andnonResourceURLs: ["/metrics"]with verbgetfor the control-plane probe’s apiserver metrics. The drawer ships copy-paste YAML that creates exactly this. - The control-plane probe through a proxy needs proxy ≥ 1.264.0 (an older proxy polls the cluster as before, and the card says to update it).
- Optional — Trivy Operator reports: get/list on
vulnerabilityreports,sbomreports(and the cluster-scopedclustervulnerabilityreports,clustersbomreports, counted only) in apiGroupaquasecurity.github.io. With it, each running image's SBOM becomes its real component list and its vulnerability report the scanner's verdicts (Software → Images, Vulnerabilities → By image); without it (403) images keep their tag-only components, and a cluster without the operator is silent. The form's “Trivy Operator reports” block turns it off or sets the interval (default 60 min). The operator re-creates every report on its TTL (24 h by default) and each recreated report is read again (identical content writes nothing) — a run reads at most Software inventory: scanner reports read a run (Admin, 1 000 on Postgres), so a cluster with more than about 24 × that many reports falls behind: raise it or the operator's TTL. - HTTPS reach to the API server (typically port 6443) from the Topologix server or a proxy agent inside the cluster network. Self-signed API certificates are accepted with the verification toggle.
1 · Set up the integration
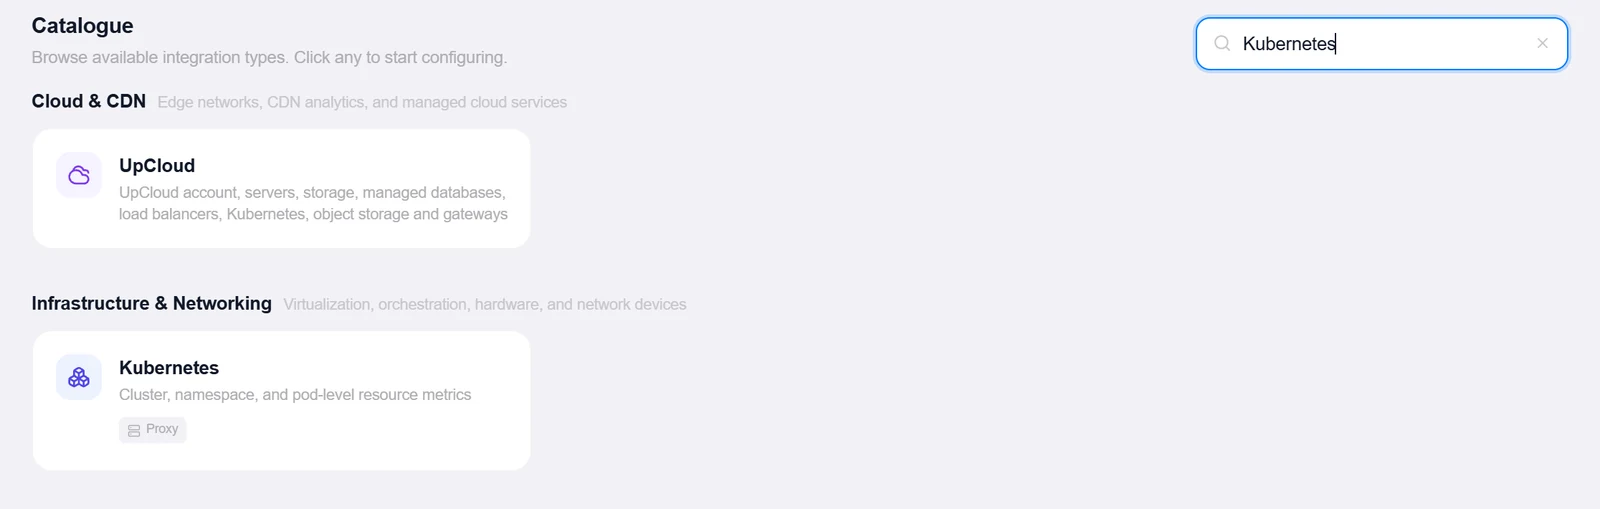
- Open the Integrations pageClick Integrations in the toolbar and pick Kubernetes from the catalogue.
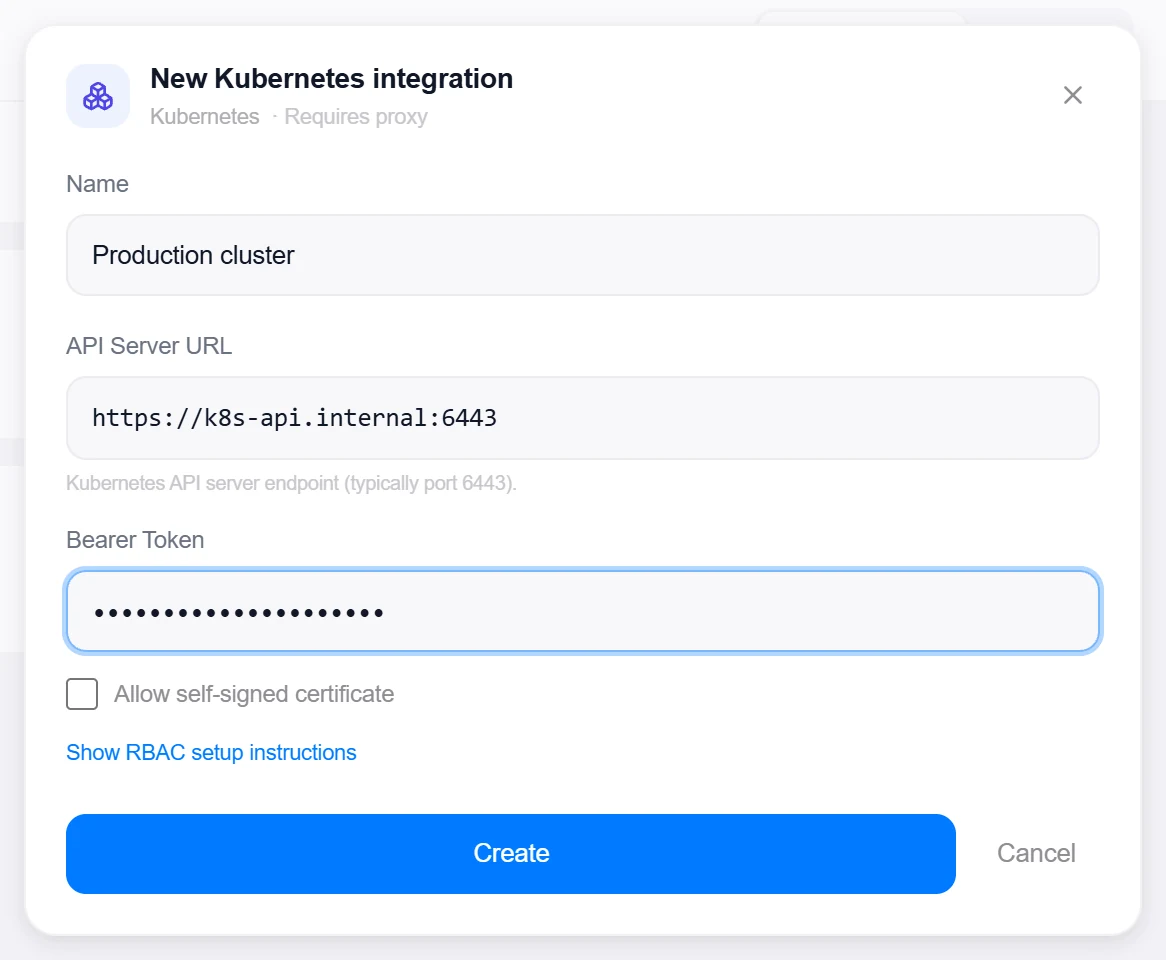
- Create the read-only ServiceAccountClick Show RBAC setup instructions in the drawer and apply the YAML — ServiceAccount, token Secret, ClusterRole, binding — then extract the token with the printed
kubectl get secretcommand. - Enter the API server URL and tokenThe API Server URL (e.g.
https://10.0.0.10:6443— a barehost:portworks too, https is assumed) and the Bearer Token. Tick Allow self-signed certificate for the usual on-prem cluster CA. - Create, then verifyClick Create, then reopen the integration and click Test — it reads
/versionand reports the cluster version, then the control plane:control plane: ready(orNOT ready (etcd)) andmetrics: ok(or403 — add nonResourceURLs ["/metrics"]when the ClusterRole lacks that rule). A 401 means a bad token; a 403 means the token authenticated but lacks RBAC.
2 · Add it to a flow
- Select the cluster nodeClick the node, open Metrics, then + Add and choose the Kubernetes integration.
- Pick a scopeTwo tabs: Cluster — the combined problems-plus-rollup view — or Namespace, which multi-selects discovered namespaces and fans out one source per namespace.
- SaveSet the interval and click Add Source. The card shows nodes ready, namespaces, pod counts, and metrics-server CPU/memory totals with top pods — and, in cluster scope, the problem list on top.
3 · Beyond presets: custom queries & the All-Services alarm
Cluster
The combined view: problem pods first — CrashLoopBackOff, ImagePullBackOff, OOMKilled, stuck Pending past 5 minutes, NotReady past a 2-minute grace, high restarts — grouped by namespace with a per-pod events drill-in, and the cluster rollup (nodes, namespaces, pods, resource usage) beneath.
- Any problem pod breaches its namespace (the threshold is 0); breach state auto-clears after sustained clean polls (default 10), and per-namespace problem lists cap at 50 pods.
- An optional namespace allowlist limits problem detection — empty means the whole cluster. Restart flagging defaults to more than 5 restarts within 60 minutes.
- The per-pod View events drill-in shows kubectl-describe-style Events; it degrades to an empty list on RBAC 403 — the drawer’s RBAC snippet doesn’t include
eventsread, so add it to the ClusterRole if you want the drill-in. - Control plane: each poll also asks the API server whether it is ready (
/readyz?verbose— etcd, informers, post-start hooks) and, unless the integration’s apiserver /metrics checkbox is off, reads its own metrics (capped at 16 MiB): etcd request p99 and error share as the API server sees them, terminated requests, 5xx and requests in flight — figures per poll, so the first poll shows them empty. Built-in alerts, editable under Control-plane alerts in the source: API server not ready → error at once; terminations above 0 /min, etcd p99 above 500 ms or errors above 1 % (2 of 3 polls), and 5xx above 10 /min (3 of 5) → warning. - When the pods list fails but the API server still answers (a control plane stalling under etcd), the poll keeps what it read — the Control plane row, nodes, version — and says pods not read; the problem-pod rows keep their state instead of clearing. A poll that reads nothing keeps the source’s last verdict, and each failed streak is recorded (the bot sees
poll ok → failed).
Namespace
A rollup pinned to one namespace — pod counts and metrics-server usage for just that slice. Multi-select at create time fans out one source per chosen namespace, so a shared cluster becomes per-team cards.
Good to know
- metrics-server is optional: without it the card drops CPU/memory usage and top pods but keeps counts and problem detection. Version, nodes, and namespaces are best-effort too, so a token missing cluster-scoped reads still yields the pods it can see.
- HighRestarts is recency-gated — a pod with a high cumulative restart count that has been stable longer than the window (default 60 minutes) phases out instead of flagging forever.
- The control-plane probe sees the API server that answered: behind a load-balanced VIP that is whichever instance took the request, so one poll may describe master01 and the next master02 (a counter that runs backwards between instances is dropped, not shown as a negative rate). etcd’s own fsync and leader metrics are not on the API server — they need etcd client certificates — but a stunned etcd member still shows as slow or failing etcd requests here.
- Without the
nonResourceURLsrule the metrics read is refused quietly and the card says metrics: RBAC 403; readiness still works, since any authenticated service account may read/readyz.
More Infrastructure & Networking integrations
See it on your own infrastructure
Book a demo and we will walk you through Topologix with your systems in mind: on our cloud, or self-hosted in your own network.