VMware ESXi monitoring with Topologix
Infrastructure & Networking
Standalone ESXi hosts monitored directly over each host’s vSphere SOAP API — the iLO model for hypervisors: shared credentials on the integration, each host its own metric source by IP/DNS — with host health, hardware sensors, CPU/memory, datastores, and the VMs running on the host.
Requirements
- A local ESXi account on each host (a read-only role is enough). vCenter SSO accounts don’t work for direct host access, and hosts in lockdown mode can’t be reached directly — monitor those through the vCenter integration.
- HTTPS reach to each host’s management address from the server or a proxy agent (picked per source under Run on). Self-signed certificates are accepted with the toggle.
1 · Set up the integration
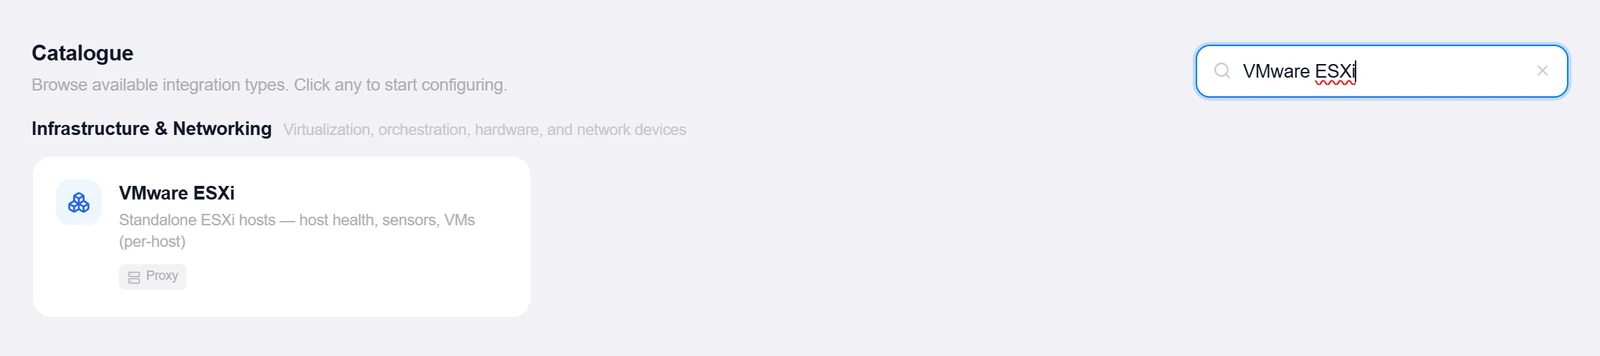
- Open the Integrations pageClick Integrations in the toolbar and pick VMware ESXi from the catalogue.
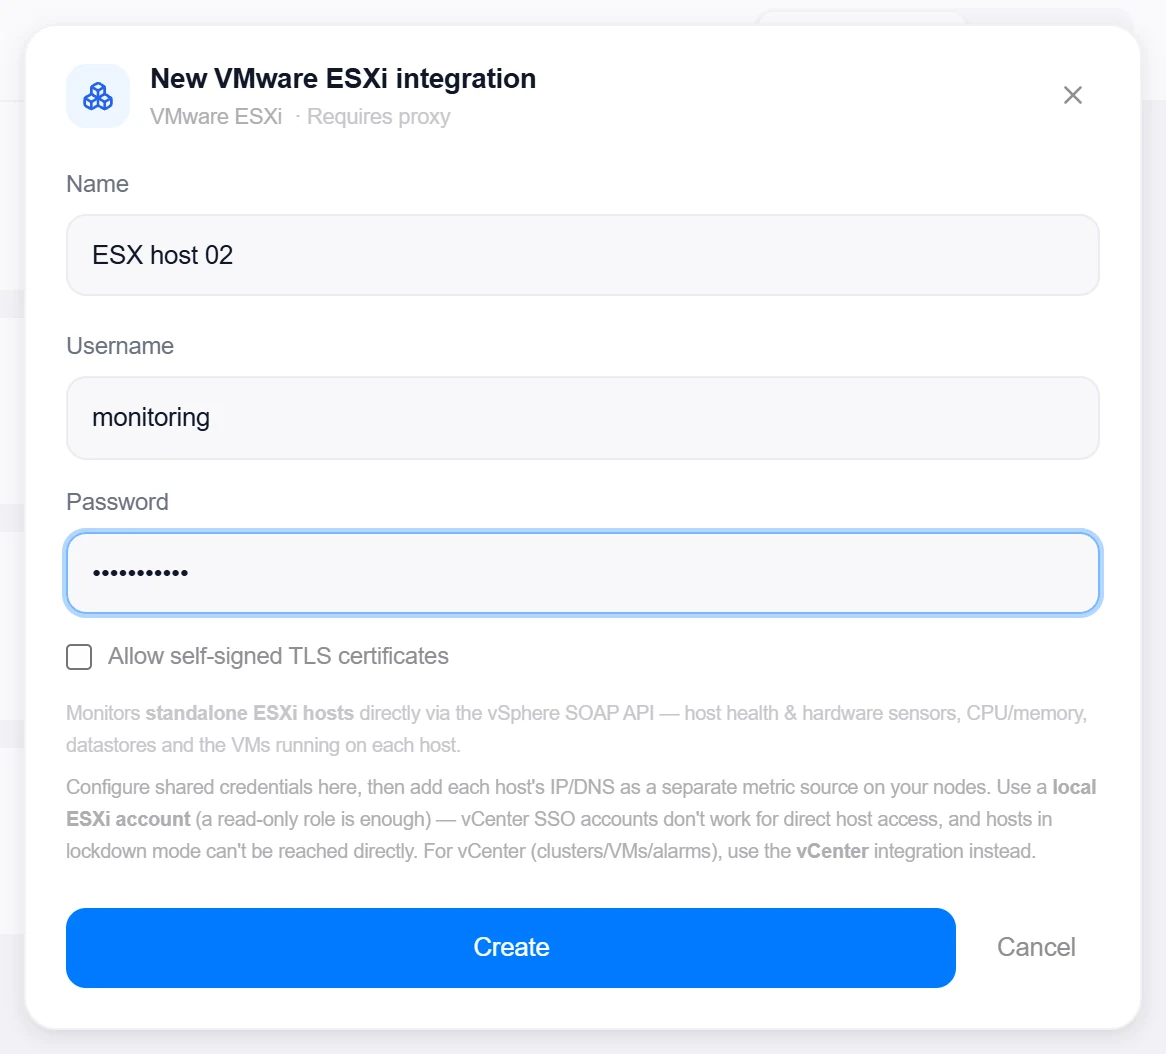
- Enter the shared credentialsUsername (e.g.
root) and Password, plus the Allow self-signed TLS certificates toggle. Individual hosts are not stored here — they live on the metric sources. - Create, then verifyClick Create, then reopen the integration, enter any host’s IP under Test Host, and click Test — it reads the host’s service content and reports the product (e.g. “VMware ESXi 8.0.2”). The test host isn’t saved, and a lockdown-mode host is called out explicitly.
Target on a private network? Route it through a proxy agent. Proxy agents run inside your network — behind NAT, on a management VLAN, in an air-gapped segment — and reach targets the Topologix server can't. The agent polls the server every 15 seconds for its assignments, runs the checks locally, and pushes results back every 5 seconds, so no inbound firewall rules are ever needed. Set a default proxy on the integration; every metric source can override it. If a proxy goes offline, its sources are marked stale within ~90 seconds and the last known values stay visible.
2 · Add it to a flow
- Select the host nodeClick the node, open Metrics, then + Add, choose the ESXi integration, and enter this host’s management IP or hostname.
- Pick a scopeHost overview — health, hardware sensors, CPU/memory, datastores and VM counts — or Single VM: click Load VMs and pick one for its CPU/memory/power state.
- SaveSet the interval and click Add Source. The host card shows overall status, uptime, CPU/memory utilization, per-datastore capacity, and sensor critical/warning counts.
Live canvas screenshots for this integration require a real VMware ESXi environment, so this guide shows the configuration screens only — the flow steps above work exactly like every other integration.
Good to know
- Standalone ESXi does not expose the vCenter REST Automation API, so everything speaks SOAP against the host’s
/sdkendpoint — the host’s real moref names are read from the service content first, since they differ from vCenter’s. - The free ESXi hypervisor licence (discontinued by Broadcom in 2024, reinstated with 8.0 U3e in 2025) locks the host API to read-only — which is all this integration needs.
More Infrastructure & Networking integrations
See it on your own infrastructure
Book a demo and we will walk you through Topologix with your systems in mind: on our cloud, or self-hosted in your own network.