DHCP monitoring with Topologix
Infrastructure & Networking
Windows DHCP server health over WinRM — per-scope utilization headroom as both percent and absolute free addresses, so a small scope near exhaustion isn’t masked by a low percentage — plus DHCP failover relationships, which must be in the NORMAL state.
Requirements
- A low-privilege domain account with WinRM (HTTPS/5986) access to the DHCP server(s). Credentials are stored server-side and never sent to the browser.
- WinRM reach from the Topologix server or — recommended — a proxy agent on the LAN.
1 · Set up the integration
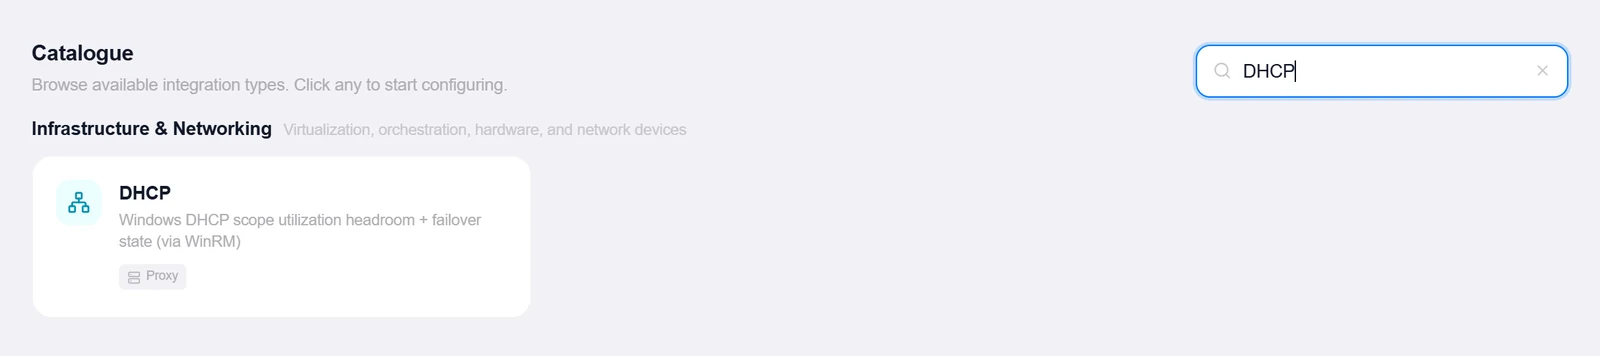
- Open the Integrations pageClick Integrations in the toolbar and pick DHCP from the catalogue.
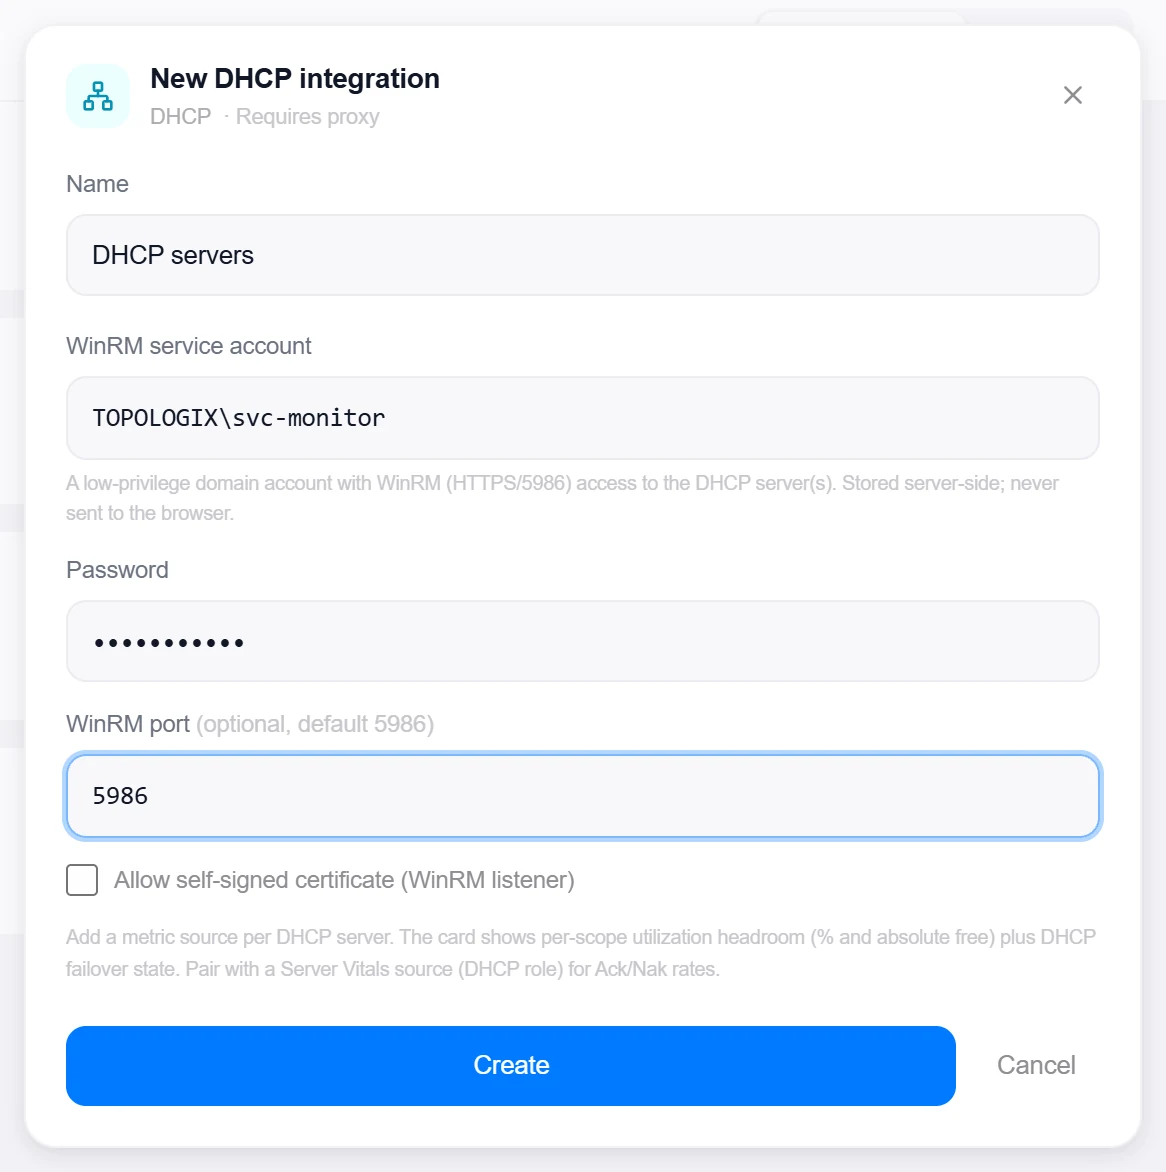
- Enter the WinRM accountWinRM service account (e.g.
CORP\svc-monitor), Password, optional WinRM port (default 5986), and the self-signed listener toggle. - Pick the proxyConnect via proxy (recommended) for DHCP servers on the LAN.
- Create, then verifyClick Create, then reopen the integration, enter a server under Test DHCP server host, and click Test to verify WinRM access. Each DHCP server becomes its own metric source.
Target on a private network? Route it through a proxy agent. Proxy agents run inside your network — behind NAT, on a management VLAN, in an air-gapped segment — and reach targets the Topologix server can't. The agent polls the server every 15 seconds for its assignments, runs the checks locally, and pushes results back every 5 seconds, so no inbound firewall rules are ever needed. Set a default proxy on the integration; every metric source can override it. If a proxy goes offline, its sources are marked stale within ~90 seconds and the last known values stay visible.
2 · Add it to a flow
- Select the DHCP nodeClick the node, open Metrics, then + Add and choose the DHCP integration.
- Point at the serverEnter the DHCP server host plus the scope thresholds: warn % (default 85) and critical % (default 95).
- SaveSet the interval and click Add Source. The card lists scopes worst-utilization first with free/in-use counts, the max utilization, how many scopes are over warn/critical, and every failover relationship with its state.
Live canvas screenshots for this integration require a real DHCP environment, so this guide shows the configuration screens only — the flow steps above work exactly like every other integration.
Good to know
- Data comes from a fixed PowerShell collector (
Get-DhcpServerv4ScopeStatistics+Get-DhcpServerv4Failover) on the WinRM allowlist — no free-form remote commands. - Ack/Nak rates and the rogue-server signal come from the windows_exporter
dhcprole — pair a Server Vitals source on the same host.
More Infrastructure & Networking integrations
See it on your own infrastructure
Book a demo and we will walk you through Topologix with your systems in mind: on our cloud, or self-hosted in your own network.