Lenovo XCC monitoring with Topologix
Infrastructure & Networking
Lenovo ThinkSystem hardware health from the XClarity Controller’s Redfish API — temperatures with thresholds, PSUs with output watts, chassis power draw, drive and NIC state — over the same generic, service-root-discovering Redfish path as Dell iDRAC, rendered on the same BMC card as HPE iLO.
Requirements
- An XCC account (read-only is enough) — the factory local account is
USERID. - HTTPS reach to the XCC management address from the server or a proxy agent on the management network. Self-signed certificates are accepted with the verification toggle.
1 · Set up the integration
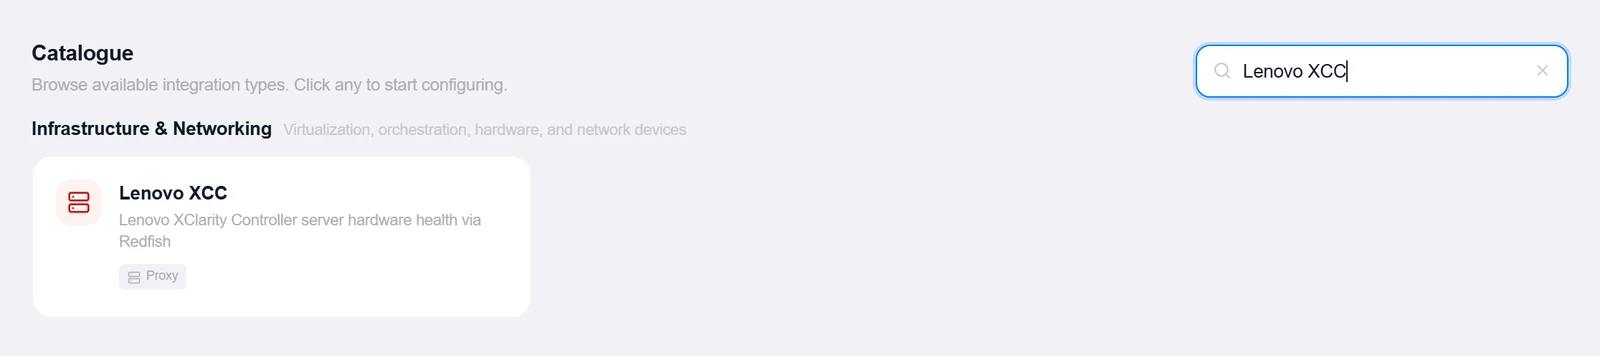
- Open the Integrations pageClick Integrations in the toolbar and pick Lenovo XCC from the catalogue.
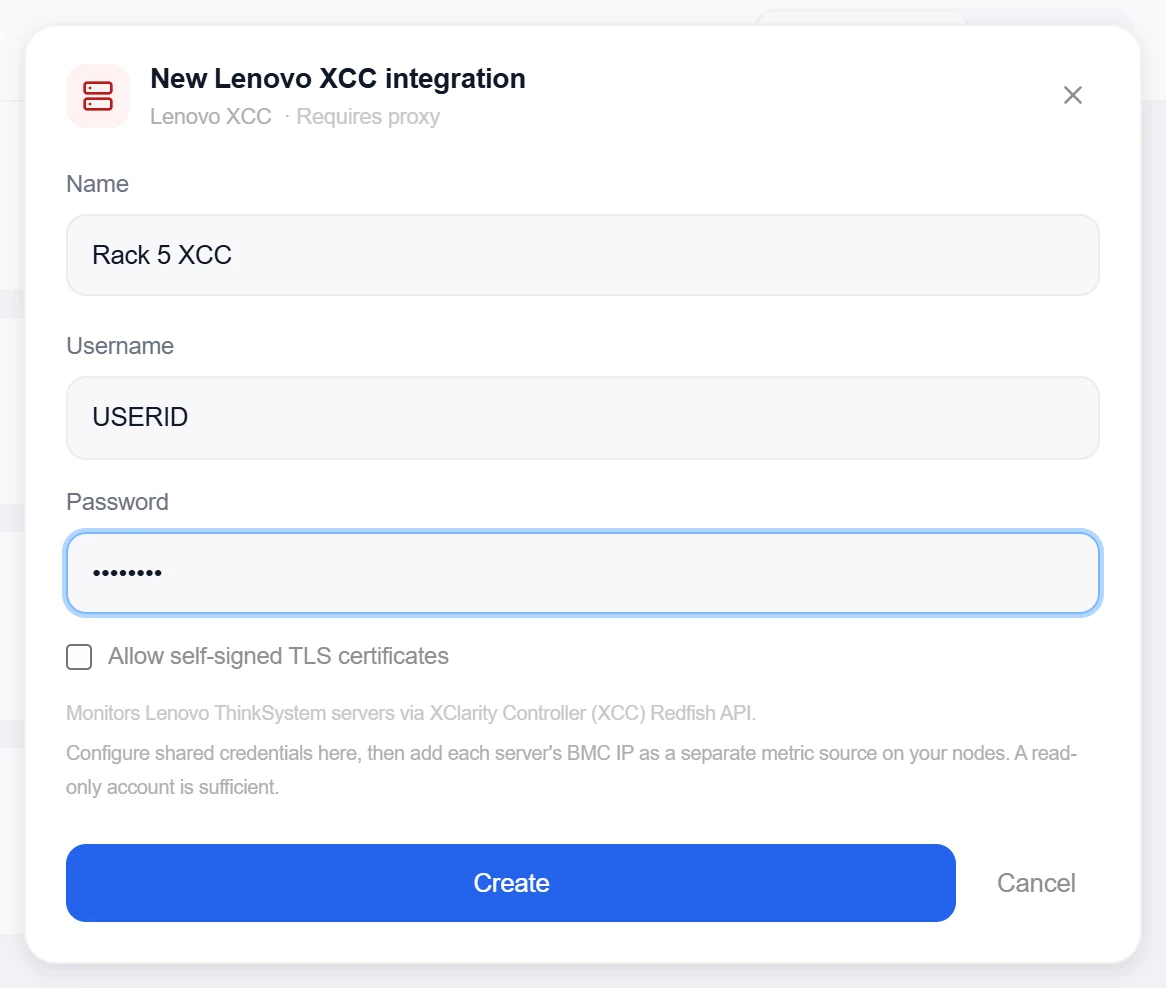
- Enter the credentialsUsername (the factory default is
USERID) and Password — individual hosts live on the metric sources. Tick Allow self-signed TLS certificates for factory certs. - Create, then verifyClick Create, then reopen the integration, enter any XCC IP under Test Host, and click Test — it walks the Redfish service root and reports the server model plus the XCC firmware. The test host isn’t saved.
Target on a private network? Route it through a proxy agent. Proxy agents run inside your network — behind NAT, on a management VLAN, in an air-gapped segment — and reach targets the Topologix server can't. The agent polls the server every 15 seconds for its assignments, runs the checks locally, and pushes results back every 5 seconds, so no inbound firewall rules are ever needed. Set a default proxy on the integration; every metric source can override it. If a proxy goes offline, its sources are marked stale within ~90 seconds and the last known values stay visible.
2 · Add it to a flow
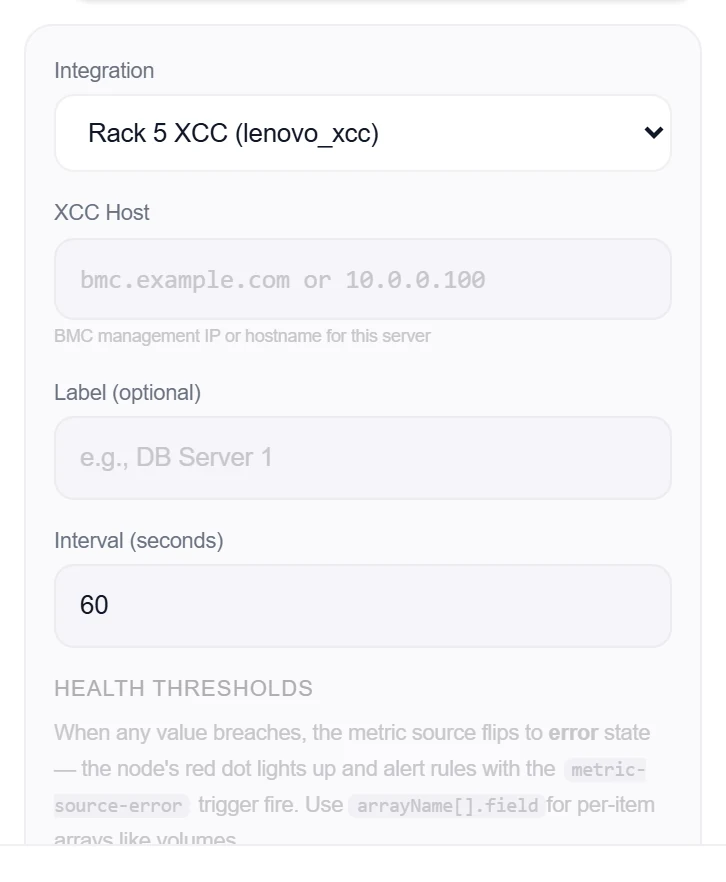
- Select the server nodeClick the node, open Metrics, then + Add and choose the XCC integration — the source form is the same as HPE iLO’s.
- Pick sensors (or take everything)Enter this server’s XCC Host, then Discover sensors — temperatures (with the XCC’s own thresholds), PSUs, drives, and NICs by name. Leave the selection empty to track everything; optionally pick one temperature as the color-coded card pill.
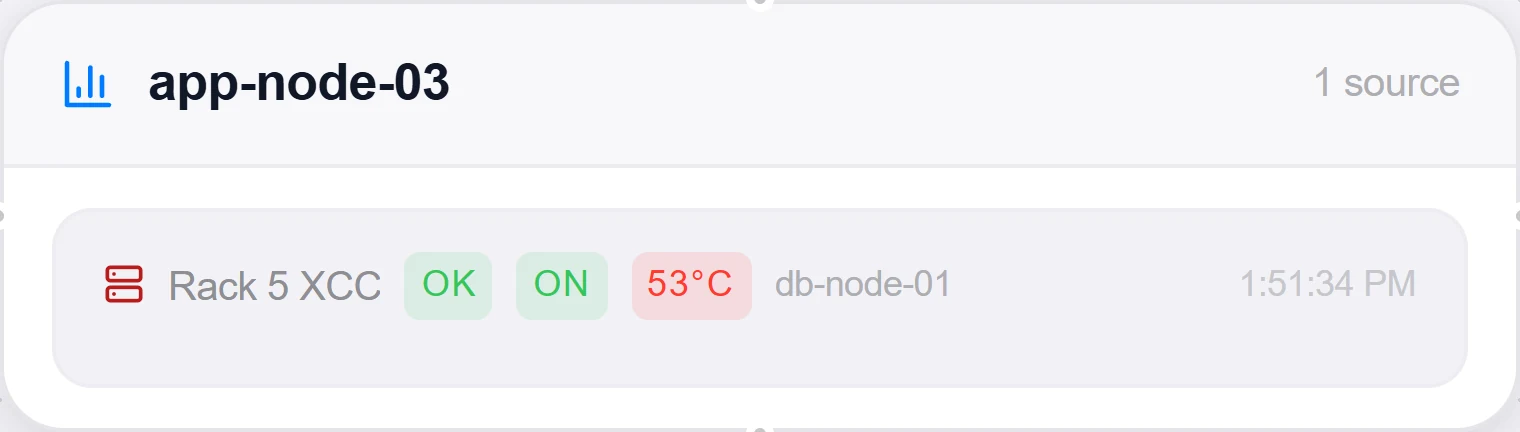
- SaveClick Add Source. The card shows power state, overall health, and every tracked sensor grouped under Temperatures / Power / Storage / Network; any sensor going Critical turns the card red.
Good to know
- Shares its fetcher with Dell iDRAC: collections are discovered from the Redfish service root, PSU wattage is read from the standard
PowerOutputWatts, and drives/NICs are walked best-effort via Storage→Drives and EthernetInterfaces. - One integration covers the fleet — credentials are shared, and each ThinkSystem’s XCC IP is its own metric source with its own sensor selection.
- Warranty. Lenovo publishes no warranty lookup API, so an XCC server’s warranty row is entered by hand or imported from CSV — end date, support level and an optional note, on the card’s Set warranty button. What Topologix does automatically is the identity half: because XCC rides the same Redfish fetcher as iDRAC, the serial, model and machine type are captured at no extra cost and the warranty dialog opens pre-filled with the values Lenovo’s support site asks for.
- The XCC
SKUis a machine-type-model, not a Dell-style service tag, so it is never sent to any vendor API. A hand-entered record is never overwritten by a background refresh, and a server with no warranty on file stays grey on the card rather than green.
More Infrastructure & Networking integrations
See it on your own infrastructure
Book a demo and we will walk you through Topologix with your systems in mind: on our cloud, or self-hosted in your own network.