Dell PowerVault ME4 monitoring with Topologix
Infrastructure & Networking
Dell PowerVault ME4 (and ME5 via the same legacy API) array monitoring — overall health, capacity, controllers with a redundancy verdict, disks, pools, PSU/fan/temperature FRUs, live IOPS and throughput, plus optional per-volume usage and latency. Credentials live on the integration; each array is a metric source addressed by IP.
Requirements
- A read-only array account (the built-in
monitorrole is enough) — the API logs in with a SHA-256 hash of the credentials, so no separate API key is needed. - HTTPS reach to each array’s management address (port 443, self-signed out of the box — the toggle accepts it) from the server or a proxy agent picked under Run on.
1 · Set up the integration
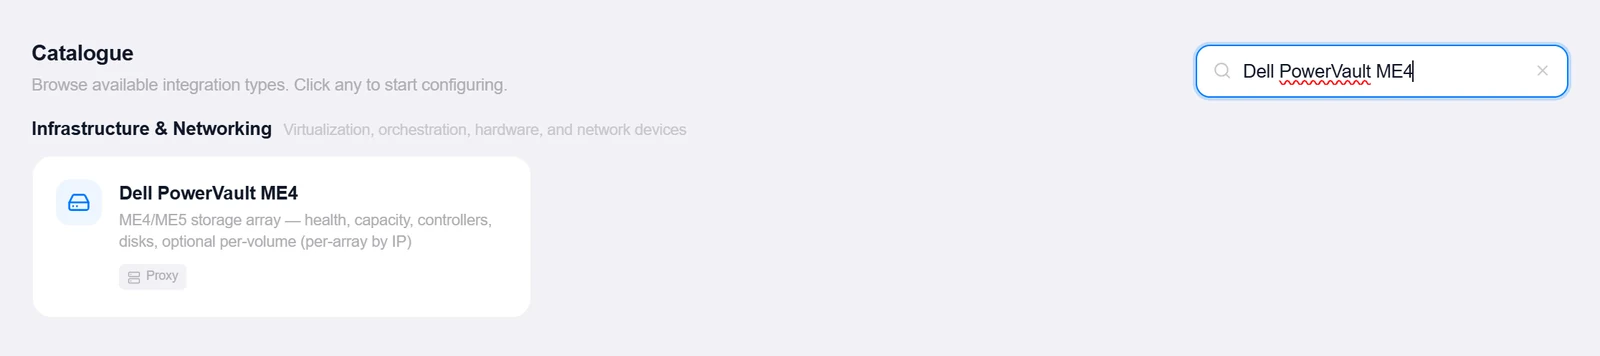
- Open the Integrations pageClick Integrations in the toolbar and pick Dell PowerVault ME4 from the catalogue.
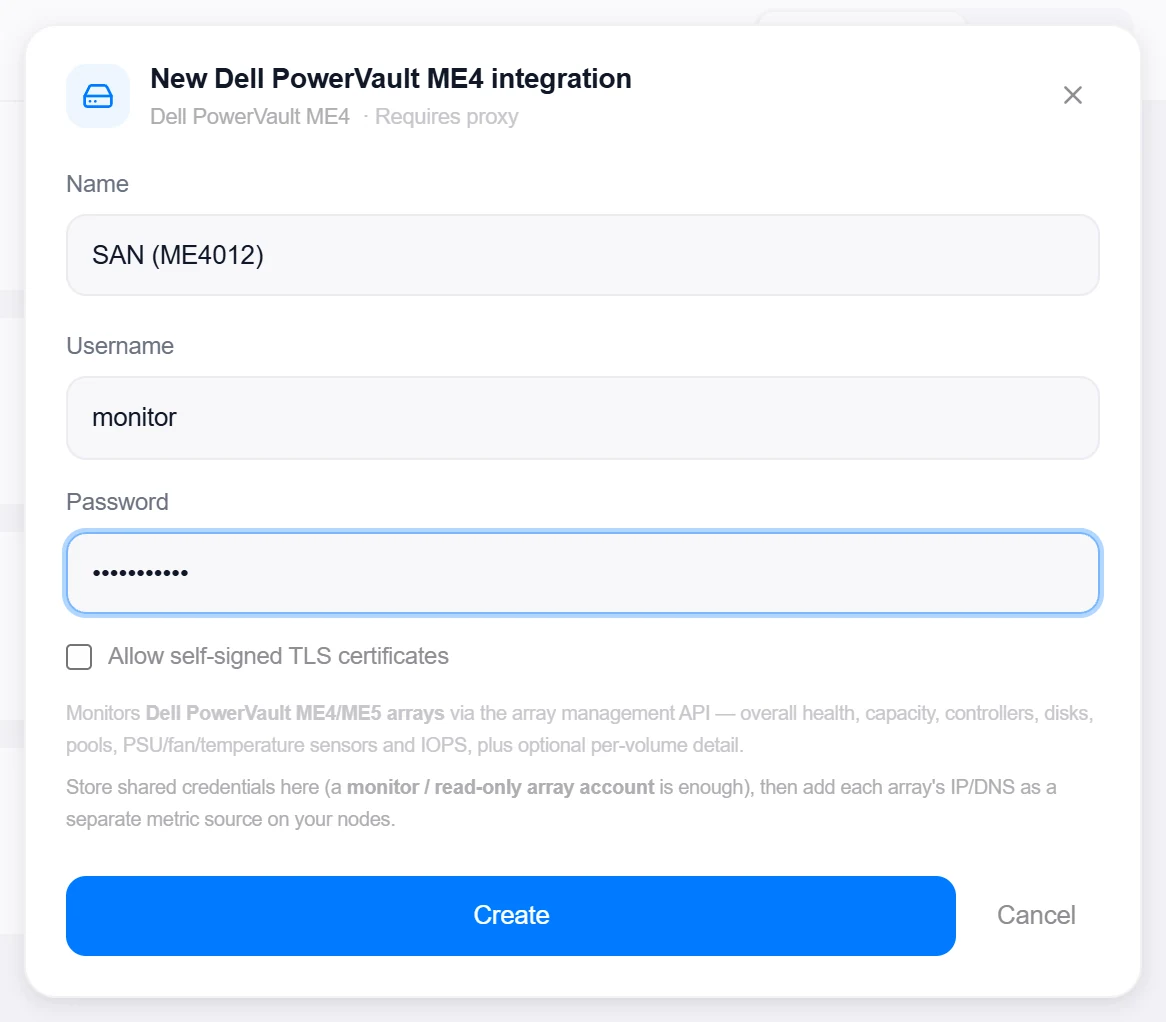
- Enter the credentialsUsername and Password for a monitor-level array account, plus the Allow self-signed TLS certificates toggle. Individual arrays live on the metric sources.
- Create, then verifyClick Create, then reopen the integration, enter any array’s management IP under Test array, and click Test — it logs in and reports the product id and system name. The test host isn’t saved.
Target on a private network? Route it through a proxy agent. Proxy agents run inside your network — behind NAT, on a management VLAN, in an air-gapped segment — and reach targets the Topologix server can't. The agent polls the server every 15 seconds for its assignments, runs the checks locally, and pushes results back every 5 seconds, so no inbound firewall rules are ever needed. Set a default proxy on the integration; every metric source can override it. If a proxy goes offline, its sources are marked stale within ~90 seconds and the last known values stay visible.
2 · Add it to a flow
- Select the storage nodeClick the node, open Metrics, then + Add and choose the PowerVault integration. Enter this array’s Array host.
- Optionally pick volumesLoad volumes lists the array’s volumes with sizes — tick the ones worth per-volume detail, or leave empty to monitor the array overview only. Three thresholds arm the alarms: Capacity % alarm, Vol used %, and Vol latency ms.
- SaveSet the interval and click Add Source. The card shows health, a controller-redundancy verdict, fault/degraded counts, capacity and per-pool bars, disk counts, live IOPS + throughput, a hardware rollup, and a row per selected volume with used %, IOPS, and latency.
Live canvas screenshots for this integration require a real Dell PowerVault ME4 environment, so this guide shows the configuration screens only — the flow steps above work exactly like every other integration.
Good to know
- Sessions are cached and reused across polls — the array caps concurrent sessions and idles them out after ~30 minutes, so per-tick logins would exhaust it; an expired session re-logs-in transparently once.
- Capacity math converts the API’s 512-byte block counts to decimal GB, and linear arrays without virtual pools fall back to disk-groups for capacity.
- The hardware rollup lists only non-OK FRUs and sensors — a clean array reads “All components nominal”.
More Infrastructure & Networking integrations
See it on your own infrastructure
Book a demo and we will walk you through Topologix with your systems in mind: on our cloud, or self-hosted in your own network.