HPE Alletra monitoring with Topologix
Infrastructure & Networking
One integration, three HPE Alletra generations picked at setup — Alletra 6000 (Nimble REST), Alletra 9000 (3PAR/Primera WSAPI), and Alletra MP / B10000 (local REST) — normalized onto one storage card: system health, capacity, and per-volume usage, IOPS, read/write latency, and throughput.
Requirements
- A read-only array account. 6000: the Nimble REST API on port 5392. 9000: the WSAPI service enabled on port 8080 (per-volume IO latency additionally needs the System Reporter module). MP: read access to storage-systems and volumes.
- HTTPS reach to the management URL from the server or a proxy agent; the Verify TLS certificate toggle covers self-signed arrays.
1 · Set up the integration
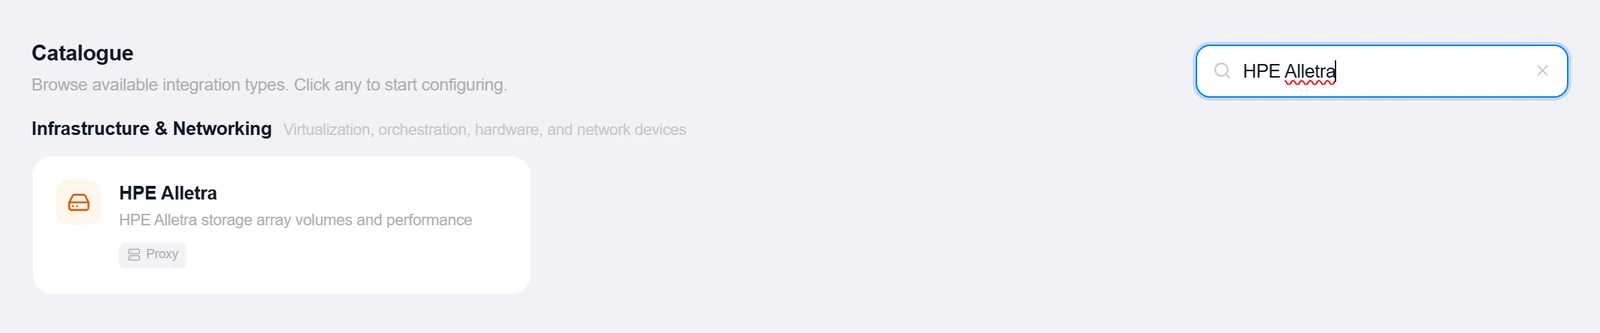
- Open the Integrations pageClick Integrations in the toolbar and pick HPE Alletra from the catalogue.
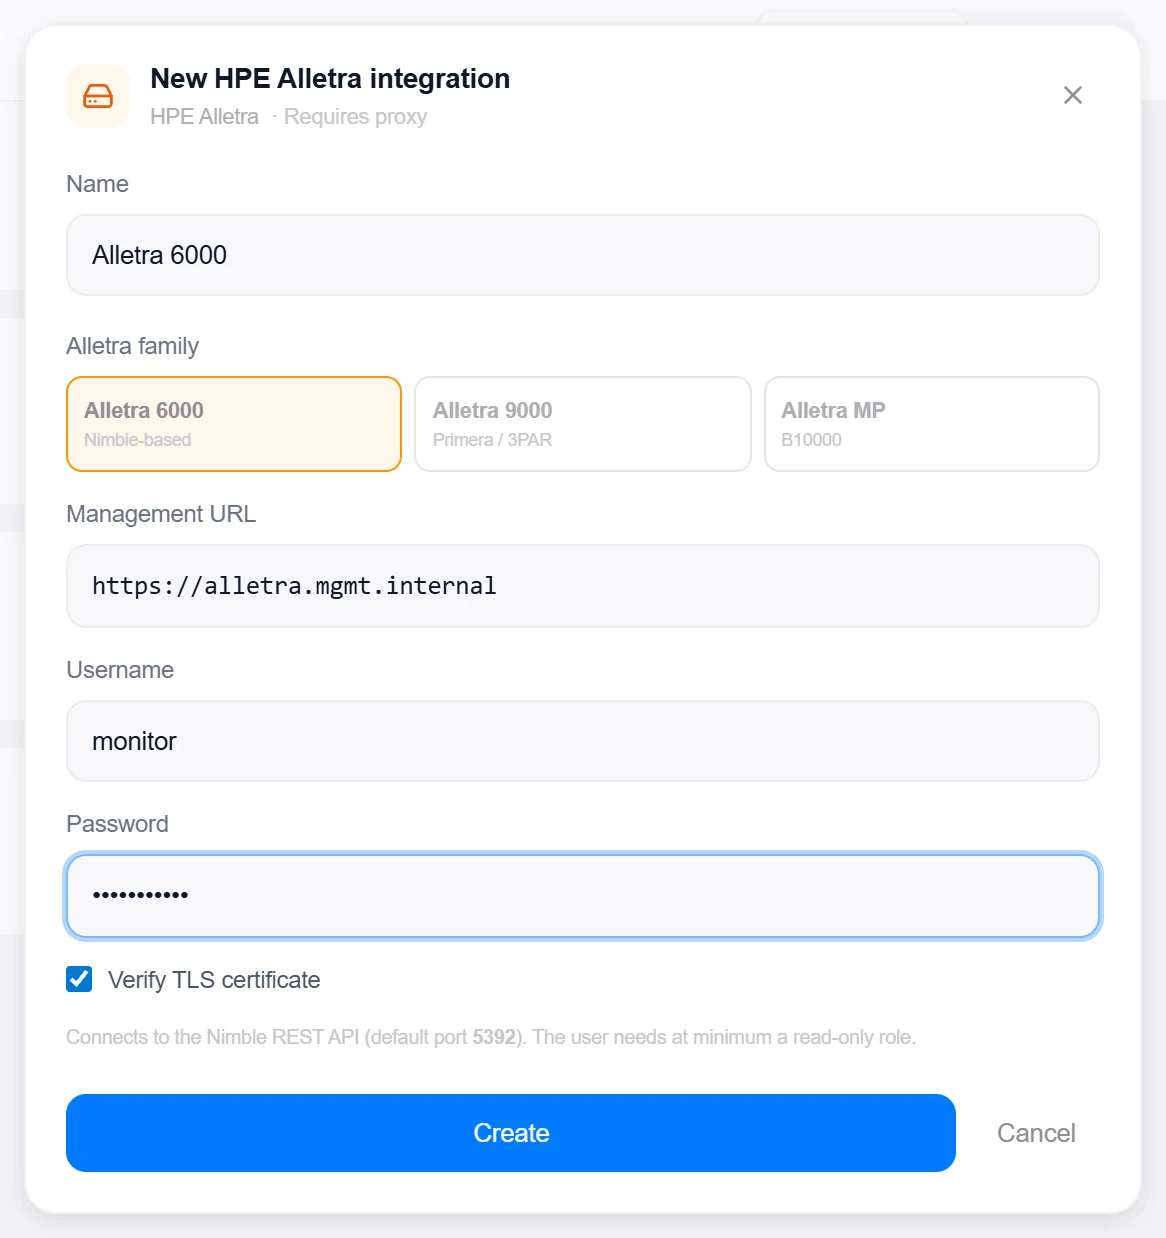
- Pick the Alletra familyThree tiles: Alletra 6000 (Nimble-based), Alletra 9000 (Primera / 3PAR), Alletra MP (B10000). The choice fixes which API the integration speaks.
- Enter the URL and credentialsThe Management URL —
https://array.example.com:5392for 6000,:8080for 9000, plain HTTPS for MP — plus Username and Password. - Create, then verifyClick Create, then reopen the integration and click Test — each family logs in its own way (Nimble session token, WSAPI session key, MP bearer token) and reports the array model and software version.
Target on a private network? Route it through a proxy agent. Proxy agents run inside your network — behind NAT, on a management VLAN, in an air-gapped segment — and reach targets the Topologix server can't. The agent polls the server every 15 seconds for its assignments, runs the checks locally, and pushes results back every 5 seconds, so no inbound firewall rules are ever needed. Set a default proxy on the integration; every metric source can override it. If a proxy goes offline, its sources are marked stale within ~90 seconds and the last known values stay visible.
2 · Add it to a flow
- Select the storage nodeClick the node, open Metrics, then + Add and choose the Alletra integration.
- Pick volumesThe source lists the array’s volumes (with pool names and sizes) automatically — tick the ones to monitor, and optionally set the Volume latency threshold (ms) and Used % threshold that turn a volume row red.
- SaveSet the interval and click Add Source. The card shows array health, a capacity bar, system-level IOPS / read & write latency / MB/s rolled up from the selected volumes, and a row per volume with size, used %, IOPS, latencies, and throughput.
Live canvas screenshots for this integration require a real HPE Alletra environment, so this guide shows the configuration screens only — the flow steps above work exactly like every other integration.
Good to know
- The system-performance headline is aggregated from the selected volumes (latency weighted by IOPS) — pick the busy volumes for a representative number.
- Login sessions are cached per array and re-login transparently on 401/403, so an array reboot or an admin revoking sessions doesn’t error a poll.
- Nimble reports latencies in microseconds and sizes in MiB — both are normalized; a volume the account can’t read degrades to a zero-size row instead of failing the whole source.
More Infrastructure & Networking integrations
See it on your own infrastructure
Book a demo and we will walk you through Topologix with your systems in mind: on our cloud, or self-hosted in your own network.