Dell iDRAC monitoring with Topologix
Infrastructure & Networking
Dell PowerEdge hardware health straight from the iDRAC’s Redfish API — temperatures with the device’s own caution/critical thresholds, PSU health and output watts, chassis power draw, drive and NIC state. Resources are discovered from the Redfish service root, so iDRAC 8, 9, and 10 all work without hard-coded paths.
Requirements
- An iDRAC account (read-only is enough) on iDRAC 8, 9, or 10.
- HTTPS reach to the iDRAC management address from the server or a proxy agent on the management network. Self-signed certificates are accepted with the verification toggle.
- Optional, for automatic warranty lookup: a Dell TechDirect API client id and client secret whose key is entitled for the Warranty / Asset Entitlements API (an admin adds that entitlement to the key in TechDirect). They are entered on this integration and used by the Topologix server only — they are never pushed to a proxy agent and never sent to the browser. Without them, warranty is entered by hand or imported from CSV exactly as it is for HPE and H3C.
1 · Set up the integration
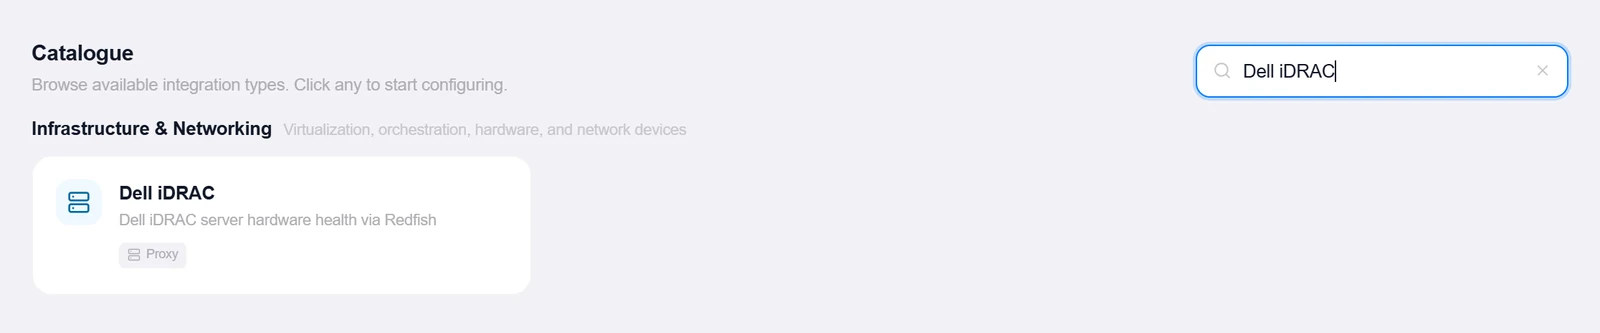
- Open the Integrations pageClick Integrations in the toolbar and pick Dell iDRAC from the catalogue.
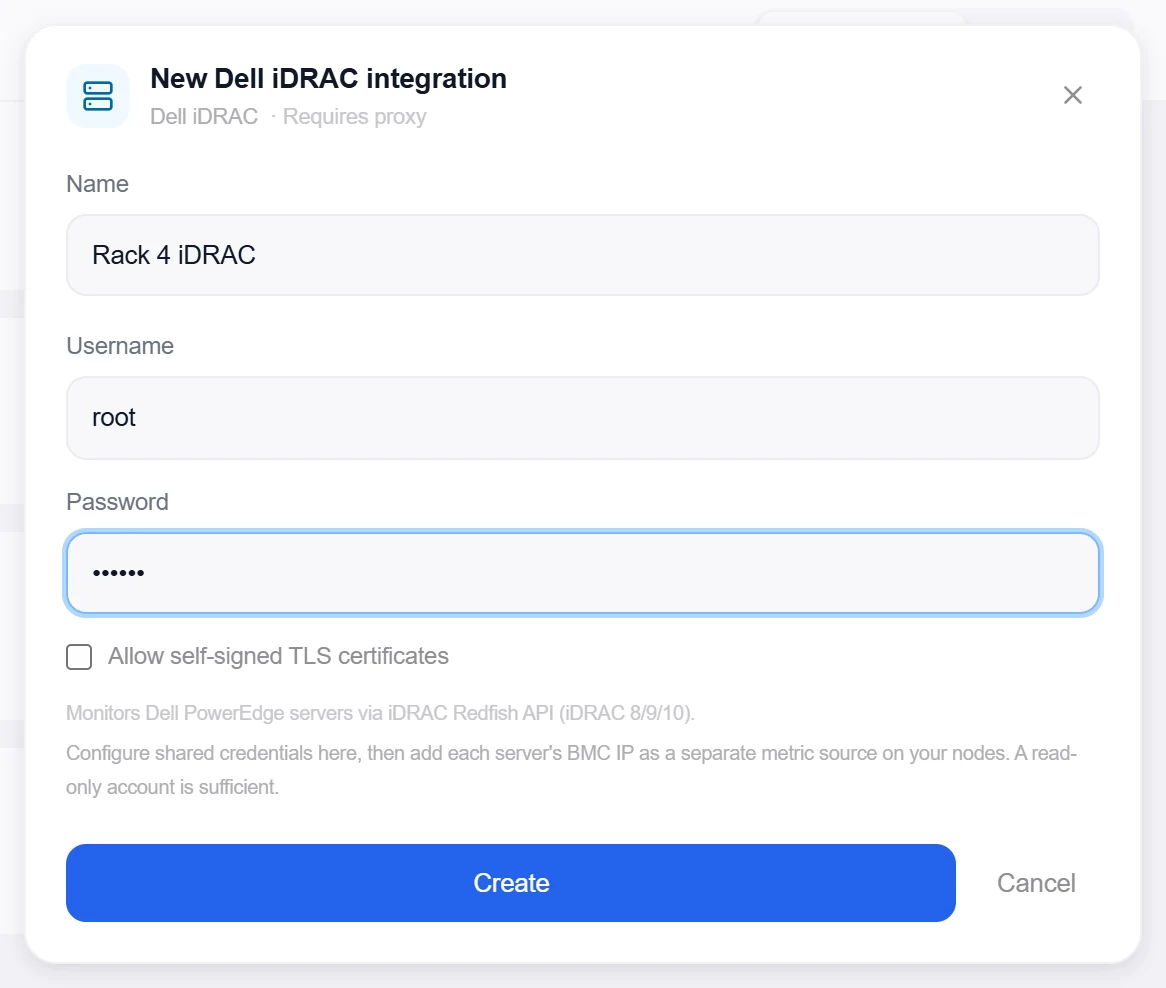
- Enter the credentialsJust Username (typically
root) and Password — individual hosts live on the metric sources, so one integration covers the whole fleet. Tick Allow self-signed TLS certificates for factory certs. - Create, then verifyClick Create, then reopen the integration, enter any iDRAC IP under Test Host, and click Test — it walks the Redfish service root and reports the server model plus the BMC model and firmware. The test host isn’t saved.
- Optionally add Dell TechDirect credentialsReopen the integration, open Warranty lookup, paste the TechDirect Client ID and Client secret, and click Test warranty credentials. Add a service tag to the test and it also runs a one-tag entitlement call — the only way to catch a key that authenticates happily but isn’t entitled for the Warranty API, which otherwise shows up a week later as empty cards. Credentials are stored encrypted, redacted on read, and stay on the Topologix server.
Target on a private network? Route it through a proxy agent. Proxy agents run inside your network — behind NAT, on a management VLAN, in an air-gapped segment — and reach targets the Topologix server can't. The agent polls the server every 15 seconds for its assignments, runs the checks locally, and pushes results back every 5 seconds, so no inbound firewall rules are ever needed. Set a default proxy on the integration; every metric source can override it. If a proxy goes offline, its sources are marked stale within ~90 seconds and the last known values stay visible.
2 · Add it to a flow
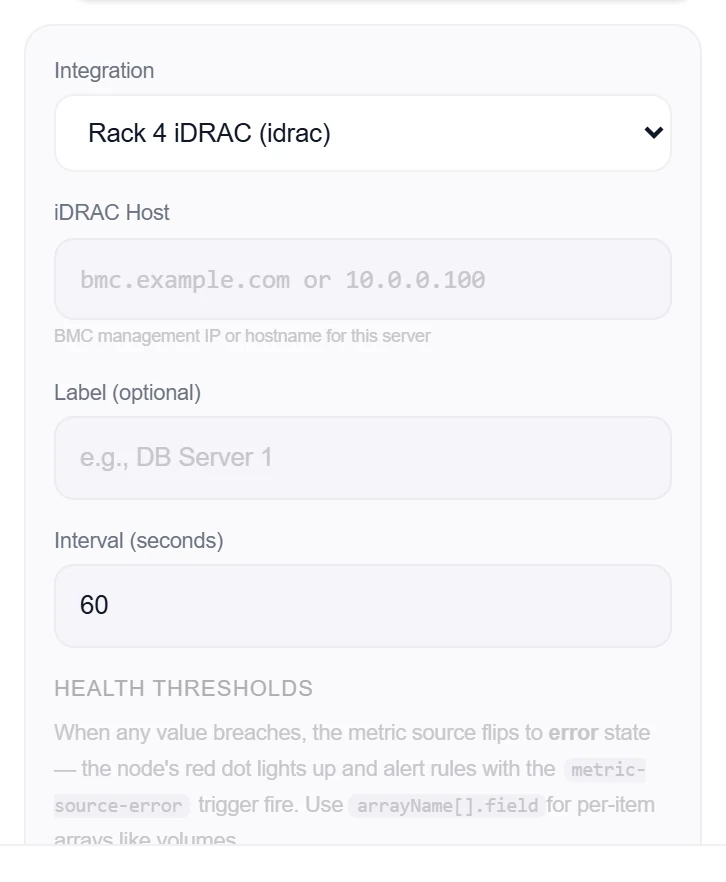
- Select the server nodeClick the node, open Metrics, then + Add and choose the iDRAC integration — the source form is the same as HPE iLO’s.
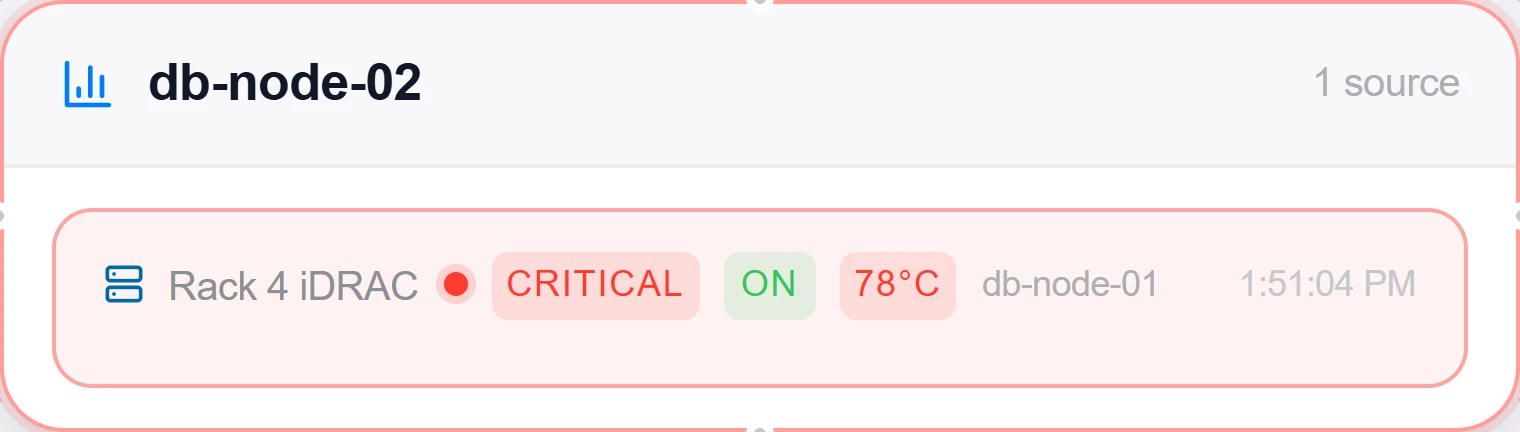
- Pick sensors (or take everything)Enter this server’s iDRAC Host, then Discover sensors — every temperature (with the iDRAC’s own thresholds), PSU, drive, and NIC by name. Leave the selection empty to track everything; optionally pick one temperature as the Card temperature badge, a color-coded pill (green < 35°C · orange ≥ 35°C · red ≥ 39°C).
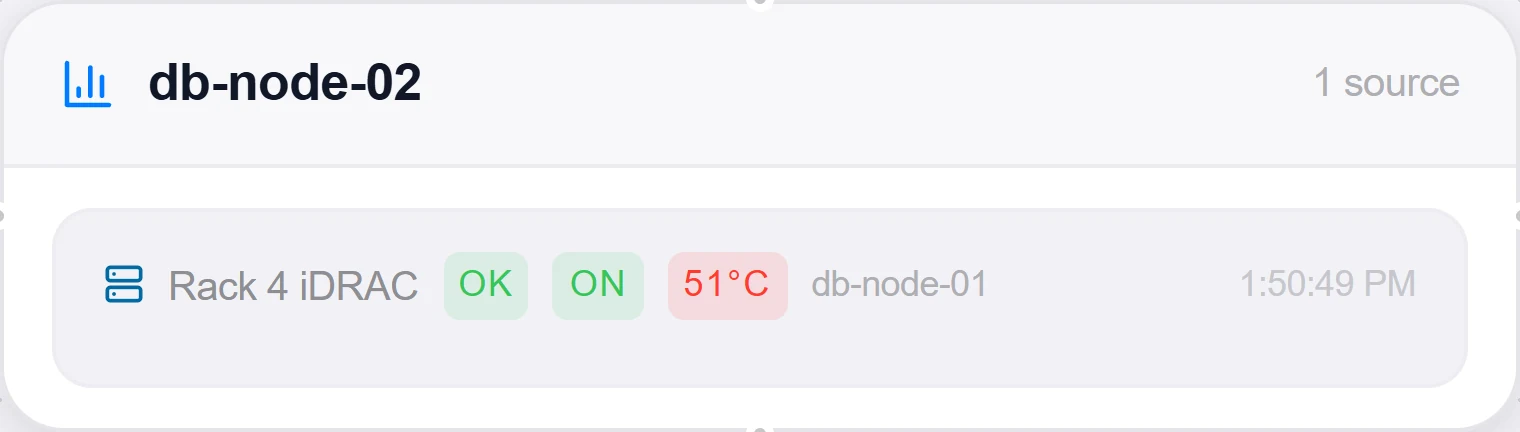
- SaveClick Add Source. The card shows power state, overall health, and every tracked sensor grouped under Temperatures / Power / Storage / Network, Critical rows sorted first; any sensor going Critical turns the card red.
Good to know
- Same generic Redfish fetcher as Lenovo XCC: Systems, Chassis, and Managers are discovered from
/redfish/v1/instead of assumed at fixed ids, so firmware that mounts them elsewhere still works. - Differences vs the iLO fetcher: PSU wattage is the standard
PowerOutputWatts(iLO readsLastPowerOutputWatts), and drives come best-effort from the standard Storage→Drives links rather than iLO’s SmartStorage — so there is no "skip drives" toggle here. - Fans and absent components (empty DIMM slots, unplugged PSUs) are handled the iLO way: fans count into the health aggregates but aren’t offered in the picker, and Absent sensors are skipped entirely.
- Warranty. The card carries a warranty row — support level, end date, days remaining — looked up by Service Tag, which on PowerEdge is the Redfish
SKU(7 alphanumerics) and is usually mirrored into the serial. The card shows the tag separately from the serial, and only the tag is ever sent to Dell; if the two fields disagree, the one with the tag shape is used and the other is kept on the record with a note. - The date shown is the latest end date across every entitlement line Dell returns, not the first one. A PowerEdge routinely carries a base warranty plus a paid extension, and showing the base date would tell you coverage lapsed on a machine that is still covered — so you’d re-buy support you already own. Every line Dell sent is stored and listed in the warranty dialog, so you can see which one set the date; Topologix filters none of them, because Dell’s entitlement-type vocabulary varies by product line.
- A warranty you type in — or import from CSV — always wins: the background refresh never overwrites a hand-entered record. Clear it and Dell’s answer takes over again on the next refresh.
- Warranty refreshes in the background roughly once a week per server, staggered so a whole fleet costs one or two Dell calls per tick (one call carries up to 100 service tags). Refresh from Dell in the warranty dialog does one machine immediately. A server whose warranty is unknown stays grey on the card — it is never coloured green.
More Infrastructure & Networking integrations
See it on your own infrastructure
Book a demo and we will walk you through Topologix with your systems in mind: on our cloud, or self-hosted in your own network.