Nutanix monitoring with Topologix
Infrastructure & Networking
Nutanix cluster monitoring — the vCenter analog for AHV: cluster CPU/memory/storage, nodes, storage containers, controller IOPS and latency, data resiliency, alerts, and per-VM cards — over Prism Central’s v4 API or a Prism Element cluster’s v2.0 API.
Requirements
- A read-only Prism account — the Cluster Viewer role is sufficient; Topologix only reads cluster/host/VM/storage summaries and alerts.
- HTTPS reach to the Prism VIP on port 9440 from the server or a proxy agent. Plain REST with Basic auth and JSON; self-signed certificates are accepted with the toggle.
1 · Set up the integration
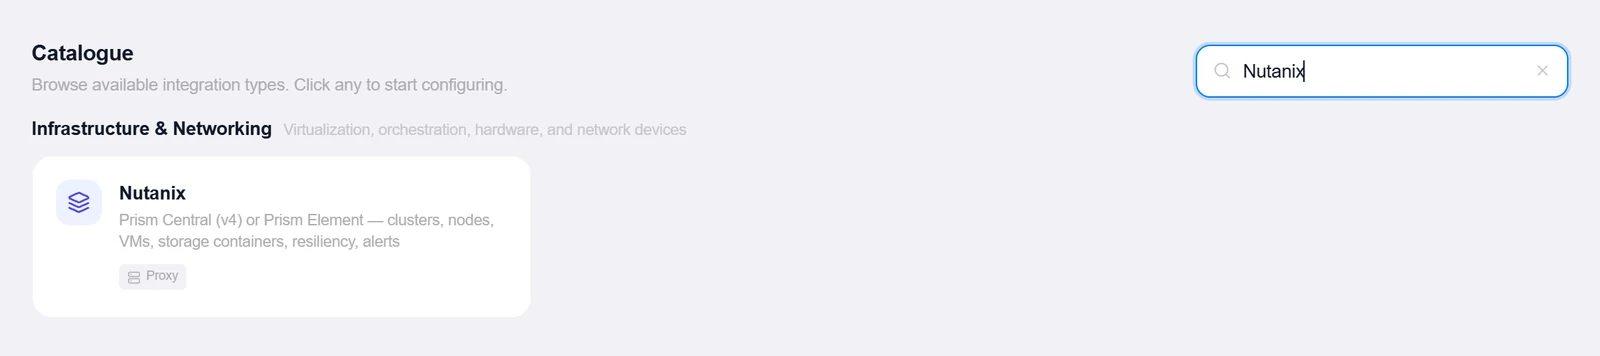
- Open the Integrations pageClick Integrations in the toolbar and pick Nutanix from the catalogue.
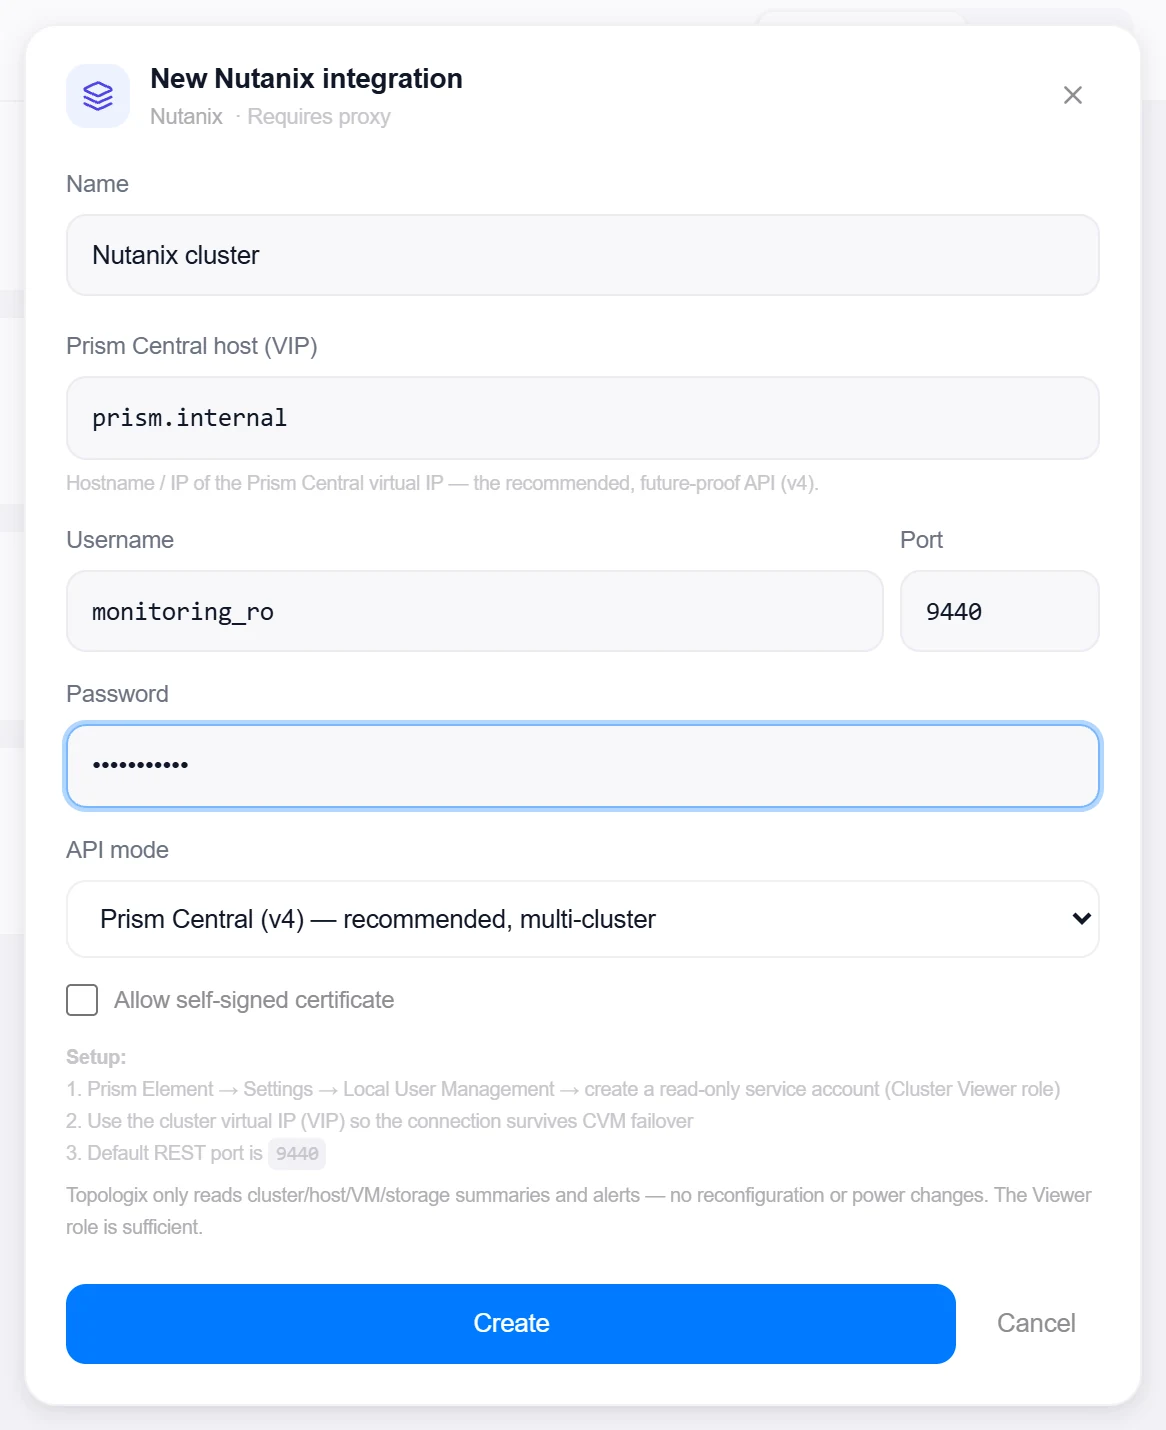
- Pick the API modePrism Central (v4) — recommended, multi-cluster, future-proof — or Prism Element (v2.0), which works without Prism Central but Nutanix deprecates Q4-2026.
- Enter the VIP and credentialsHostname/IP of the Prism Central VIP — or the Prism Element cluster VIP, so the connection survives CVM failover — plus Username, Password, and Port (default 9440).
- Create, then verifyClick Create, then reopen the integration and click Test — Prism Element reports the cluster name, node count and AOS version; Prism Central reports how many clusters it manages.
Target on a private network? Route it through a proxy agent. Proxy agents run inside your network — behind NAT, on a management VLAN, in an air-gapped segment — and reach targets the Topologix server can't. The agent polls the server every 15 seconds for its assignments, runs the checks locally, and pushes results back every 5 seconds, so no inbound firewall rules are ever needed. Set a default proxy on the integration; every metric source can override it. If a proxy goes offline, its sources are marked stale within ~90 seconds and the last known values stay visible.
2 · Add it to a flow
- Select the cluster nodeClick the node, open Metrics, then + Add and choose the Nutanix integration.
- Pick a scopeCluster — CPU/memory, storage containers (optionally narrowed to specific containers), data resiliency, nodes and top VMs — Single VM (Load VMs and pick one), or Alerts: unresolved critical/warning alerts driving the node health dot. On Prism Central also pick which cluster; Prism Element has exactly one.
- SaveSet the interval and click Add Source. The cluster card leads with utilization and resiliency, alert counts riding along for node coloring.
Live canvas screenshots for this integration require a real Nutanix environment, so this guide shows the configuration screens only — the flow steps above work exactly like every other integration.
Good to know
- Data resiliency is the vSAN-health analog: the card shows whether the cluster can currently tolerate a node/disk failure, alongside the redundancy factor.
- Prism reports perf values in parts-per-million and uses
-1for “not available” — both are normalized before they reach the card, so percentages are real percentages. - No lab hardware? Nutanix Community Edition is free and exposes the same Prism APIs — a practical way to try the integration end to end.
More Infrastructure & Networking integrations
See it on your own infrastructure
Book a demo and we will walk you through Topologix with your systems in mind: on our cloud, or self-hosted in your own network.