vCenter monitoring with Topologix
Infrastructure & Networking
vCenter monitoring per cluster — CPU/memory/storage utilization, top VMs ranked by real 5-minute performance, datastore rollups with vSAN handled separately, per-VM cards, and a dedicated Alarms scope that mirrors vCenter’s triggered-alarm list onto the canvas.
Requirements
- A vCenter SSO account with the Read-only role on the vCenter root object, propagated to children — Topologix only reads summaries and perf counters, never reconfigures or changes power state.
- HTTPS reach to vCenter from the Topologix server or a proxy agent on the management network. Self-signed certificates are accepted with the verification toggle.
1 · Set up the integration
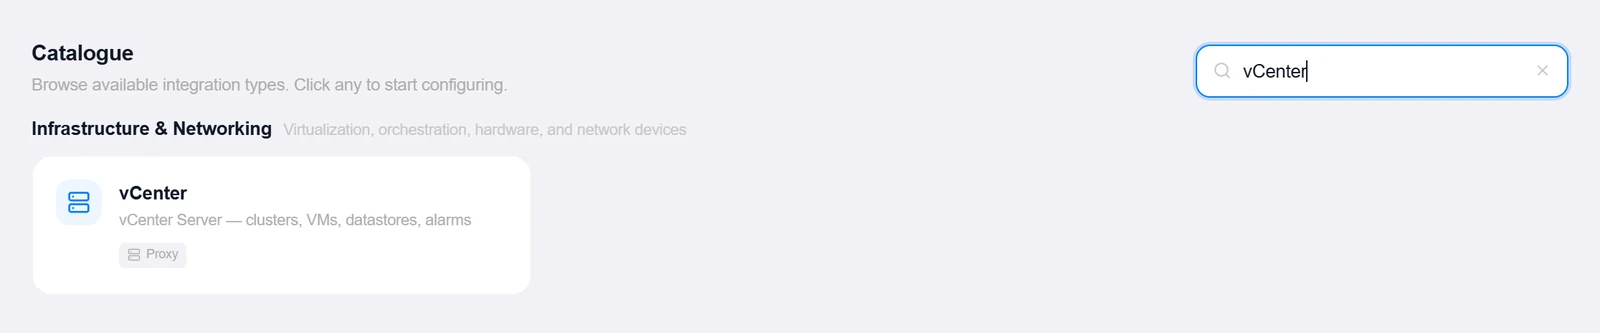
- Open the Integrations pageClick Integrations in the toolbar and pick vCenter from the catalogue.
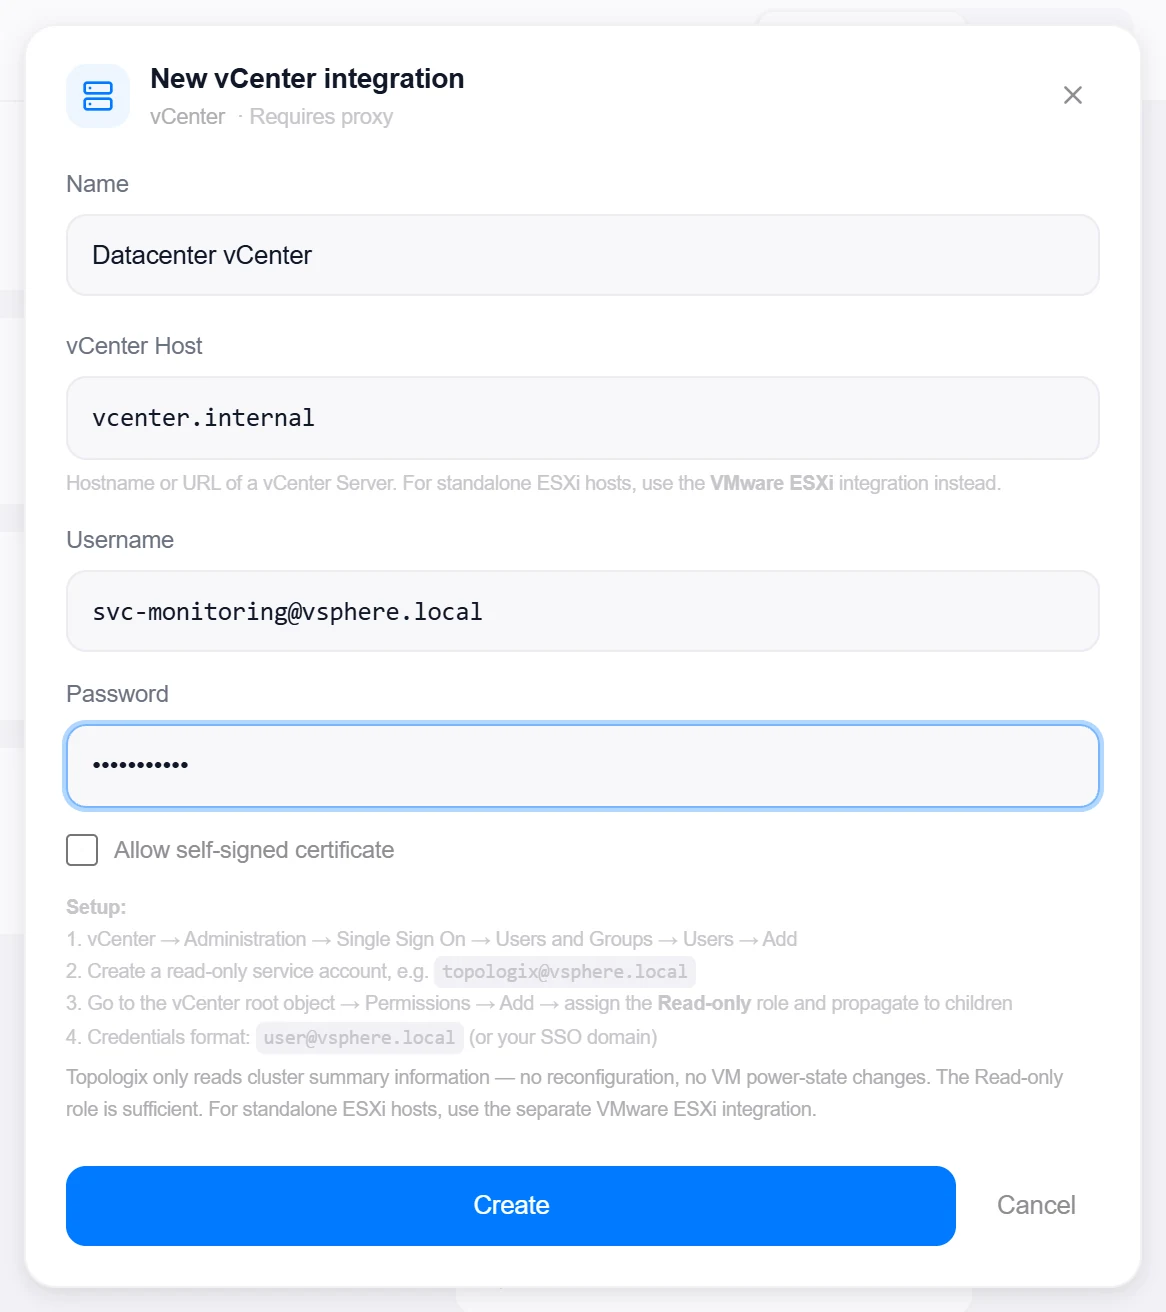
- Create the read-only accountvCenter → Administration → Single Sign On → Users and Groups → add e.g.
topologix@vsphere.local, then on the vCenter root object → Permissions → assign the Read-only role and propagate to children. - Enter the address and credentialsvCenter Host plus the username in SSO format (
user@vsphere.local) and password. For standalone hosts use the separate VMware ESXi integration instead. - Create, then verifyClick Create, then reopen the integration and click Test — it opens and closes a vCenter REST session to prove address and credentials.
2 · Add it to a flow
- Select the cluster nodeClick the node, open Metrics, then + Add and choose the vCenter integration.
- Pick cluster and scopeClusters load from vCenter automatically. Four scopes: Cluster (perf, topology, storage), Single VM (multi-select from the discovered list fans out one source per VM), Alarms, or Host logs (log error baselines per ESXi host and vSAN cluster — below). Creating a Cluster or VM source also offers a sibling Alarms source for the same cluster — on by default.
- SaveCluster sources can toggle Resource utilization and Top VMs onto the canvas node, and narrow the Storage rollup to specific datastores (empty = all non-vSAN). Set the interval and click Add Source.
3 · Failover groups and AI proposals
Right-sizing judges a standby or an active-active member by the load it must take over after a failure — never by its own idle load. Infrastructure → Hypervisors → Failover groups lists the groups that sizing already uses and the proposals for the ones it does not know yet (server 1.338.0 / client 1.308.1).
What a failover group is
Two shapes. A standby pair is a primary and one or more standbys: a passive cluster node, a warm standby, a database replica. An active-active group is a set of VMs that share the load and spread over metro sites: the nodes of a Kubernetes cluster, a Redis or HAProxy trio, a named group of application servers. The tab lists every group in use with its kind, its members (name · site · 8 vCPU / 32 GiB), how it splits across sites (3 + 3 across C9 / C10) and what that means for sizing.
| Kind | Where it comes from | Editable here |
|---|---|---|
| Replication | A data service on the VM reports streaming from a primary (PostgreSQL in recovery, a MySQL replica, an MSSQL AG secondary, an Oracle standby). | No — automatic |
| Kubernetes | The node VMs of one Kubernetes integration. | No — automatic |
| Manual | An operator’s Failover standby flag or Failover group on a VM row (VMs → expand → Failover), or an accepted proposal. | Edit members… / Dissolve with edit rights on every member’s vCenter |
| Kubernetes · merged | Two or more Kubernetes clusters merged into one group — usually the same cluster name once per site. | Unmerge with edit rights on each cluster’s integration |
The survivor factor and standby sizing
For an active-active group the survivor factor says how much more each member carries after the worst site loss: for every site, the members outside it survive its loss, and factor = members ÷ survivors, the worst over the sites. 2 + 2 → ×2; 3 + 2 → ×2.5 (losing the 3-site); it is capped at ×4. Each member is sized for its p95 load × the factor. When every member sits in one site, or a member’s site is unknown, the factor is ×1 and the tab says why (“every member is in site Secondary — a site loss takes the whole group”). A standby is sized to take over from its primary: it is compared with the primary’s size and p95 load, a standby smaller than its primary is a finding, and a standby is never called oversized because it idles.
- Sites come from the cluster’s site configuration (Hypervisors → Clusters → Sites…). Without one, groups stay at ×1.
- A manual flag wins over an automatic group: a Kubernetes node you put in a named failover group leaves its cluster’s group (and a merged one).
- Kubernetes control-plane nodes stay in their group (marked control plane) but are never scaled: each manages only its own cluster, so a site loss moves no load onto it — the site split and the factor are the workers’ (11 workers ×2 · 6 control-plane not scaled). The role comes from the node labels, else the cluster’s control-plane pods, else the node name (master, control-plane, cp1, ctrl) (server 1.339.0 / client 1.309.0).
AI proposals
Most standbys and active-active sets are not visible to the platform. A run hands the whole vCenter inventory to the AI provider of your analysis role and asks for standby pairs, active-active groups and Kubernetes merges, with evidence for each — a shared name stem, the same size and OS, a database primary and its replica, the same Kubernetes cluster name in two sites, membership of a DRS anti-affinity rule. Each proposal shows its kind, AI or Rule, a confidence (90% = name, site and engine agree; 50% = the name alone), the members by role, the evidence and a short reasoning. Nothing changes until a proposal is accepted.
- What is sent: per powered-on vCenter VM a numbered line — name, guest host name, vSphere cluster, host, site, resource pool, vCPU, memory, a short OS name, IP addresses and their /24, tags, DRS rules, the data services on it (engine and role), its Kubernetes cluster name, and the failover pairs and groups already known. VMs are numbered
#1…#nper run; the provider never sees a VM key, an integration id or a credential, and a proposal naming a number that was not sent is dropped whole. The prompt goes through your organisation’s redaction rules on the AI path first, so IP addresses and names your rules mask never leave. - Cost: one request per part of the inventory (about 400 VMs a part, at most 12 parts; 200 a part for a self-hosted model). A 934-VM vCenter is 3 requests — about 75k tokens in and 17k out. Every request counts against your AI usage like any other. A run keeps at most 150 proposals, the most confident first; the run line says how many were dropped and why.
- Weekly + Run now: organisations get a weekly run (skipped, with 0 requests, when the inventory has not changed since the last one). An organisation owner or admin can Run now (one run per 10 minutes) and Pause weekly runs. A personal account runs on demand only. The header shows the last run: “Last run · 7 Oct, 11:56 · claude-sonnet-4-6 · 3 requests · 50 proposals (25 dropped)”.
- Without an AI provider the button reads Run rules now: no request is made and only the same-name Kubernetes rule runs.
Accept, edit or reject
Accept writes exactly what the VM row’s Failover controls would — the standby flag pointing at the primary, the members of a named group — or a Kubernetes merge, and right-sizing uses it from the next fleet read. Edit… first: rename the group, pick another primary, remove members or add VMs by name. Reject (with an optional note) remembers the set: it is never proposed again, and an edited set you reject is remembered too.
- Accepting needs edit rights on every member’s vCenter (or every merged cluster’s Kubernetes integration); without them it is refused and nothing is written. If a single VM cannot be written, the tab lists which ones and why, and the proposal stays open.
- A proposal is shown only to people who can see every integration it names; anything else is “not found”. Every run, accept, reject, merge and the weekly toggle is in the audit log.
- Proposals whose VMs disappeared, or that overlap a newer proposal, are superseded at the next run.
The same-name Kubernetes rule and merges
Many sites run one Kubernetes cluster per data centre under the same name. Every run — with or without AI — checks for two or more Kubernetes integrations with the same name (case and spacing ignored) whose node VMs sit in two or more sites (or vSphere clusters when no site is known) and proposes a cluster merge (source Rule, 90%). Accepted, the clusters become one Kubernetes · merged group: its nodes are sized for the loss of a whole site, and each node’s Failover line reads “a node of Kubernetes cluster prod (2 clusters merged)”. Membership stays live — a node added to either cluster joins the group. Unmerge returns them to one group per cluster.
4 · Forensics — one entity's figures and history
Infrastructure → Forensics puts everything Topologix holds about one thing — a service, pod, Kubernetes node, VM, ESXi host, datastore, cluster, device, database or a bare IP address — on one page: the same live figures as the Topology's Forensic overlay, its metric history, its logs, traces and network flows, its events and changes, and the hardware under it. The header names it, where it runs (a hop of the runs-on chain selects its row under Where it runs — it does not leave the page) and what else it is (a node is its VM, a host its iLO). On a phone (narrower than 640 px) the header is one block — the range as 15m · 1h · 6h · 24h · 7d · ⋯, Refresh, Copy link and Back as icons, the chain folded into one “Runs on N placements” line that opens on tap — the sections are a strip of chips that stays at the top, the figures sit two to a row and every table becomes a list of cards, so nothing scrolls sideways.
Opening it
Every place that shows an entity offers it:
- the Topology card popover — Open in Forensics (with the Forensic overlay on or off);
- the Catalogue service page — Forensics in its header;
- Hypervisors → VMs / Hosts / Datastores — Forensics in an expanded row;
- a Databases system view — Forensics (it sends the row's
source:key, so the page lands on the data instance or the tenant's database); - a Flows row — the microscope beside either end (an address no machine claims opens as an IP);
- the tab itself — the last entity, or the ones opened recently in this browser and a search over everything ⌘K finds.
The link, the range and Back
Copy link gives ?view=forensics&kind=<kind>&key=<entity key>[&name=][&range=15m|1h|6h|24h|7d | &from=&to=][§ion=] — the name is only a hint (the server's name wins), from / to (ISO or epoch milliseconds) win over range, and an unknown kind or key opens the tab's empty state. The range is 15 m · 1 h · 6 h · 24 h · 7 d · Custom; a preset moves to “now” on every Refresh, a custom window stays put (never past now, never more than 90 days back). Back and Forward step through the entities you opened; changing the range or the section does not add a step.
What each kind shows
The sections depend on what the thing is. A section whose sources exist but cannot be read says so in one sentence instead of disappearing; Query builder and Ask the bot are on every kind.
| Kind | Figures | Where it runs | RECAP problems | Metrics | Logs | Traces | Flows | Events & changes | Hardware |
|---|---|---|---|---|---|---|---|---|---|
| Service | ✓ | ✓ | ✓ | ✓ | ✓ | ✓ | ✓ | ✓ | ✓ |
| Pod | ✓ | ✓ | ✓ | ✓ | ✓ | ✓ | ✓ | ✓ | — |
| K8s node | ✓ | ✓ | ✓ | ✓ | ✓ | ✓ | ✓ | ✓ | ✓ |
| VM | ✓ | ✓ | ✓ | ✓ | ✓ | ✓ | ✓ | ✓ | ✓ |
| Host | ✓ | ✓ | ✓ | ✓ | ✓ | ✓ | ✓ | ✓ | ✓ |
| Datastore | ✓ | — | — | ✓ | — | — | — | ✓ | ✓ |
| Cluster | ✓ | — | — | ✓ | — | — | — | ✓ | ✓ |
| Device | ✓ | — | — | ✓ | ✓ | — | ✓ | ✓ | ✓ |
| Database | ✓ | ✓ | ✓ | ✓ | ✓ | ✓ | ✓ | ✓ | ✓ |
| IP address | — | — | — | — | ✓ | — | ✓ | ✓ | — |
| External | — | ✓ | — | — | — | — | ✓ | ✓ | — |
The sections
What each one reads, and how far back:
- Figures — the overlay's figures for this one card, refreshed every 30 s while the tab is visible; a database's from its card's checks, connections, TPS and size. A value nothing measured reads not collected — never 0; a Hypervisors figure whose last vCenter read is too old reads not current.
- Metrics — charts of what the server already keeps (never a live read). A service gets calls per hour, error % and p95 from the trace interface history (every service the trace sampler sees, hourly), or from its trace source's rollups when they keep this service (5-minute buckets for short windows, the usual range for that weekday and hour under the line and a marker on every bucket above it), else the all-services baseline (last 24 h) or the call graph (daily); its error log lines per hour; and Where it runs — CPU and active memory of the ≤ 3 VMs most of its pods run on, with its pods' usage now (≤ 20, no history kept). A VM, host, datastore or cluster charts the Hypervisors' hourly samples over the window; a device's sensors and a database's checks chart the rollups of the sources that name them — readable whenever you can see the integration (or open the board the source sits on). Every chart names where its numbers come from and what the window really shows (a window shorter than a bucket is widened — hourly buckets — shown for the last 6 h; an empty bucket is a gap, never 0), carries the organisation's warn / error thresholds and a marker on every event of the window; what is missing is named for that entity (no trace source reports …; no log source counts its errors). Up to 90 d.
- Logs — Graylog and Elasticsearch / OpenSearch over the window, the OTLP ring, the syslog receiver's cache, Operations for Logs and pod logs (a pod, a service's pods or a node's — ≤ 20 to pick from, with the previous container), merged newest first with up to 20 error fingerprints; 100 lines a page, ≤ 200 on screen and Load more (Graylog, Elasticsearch and Operations for Logs page further back in the window; the ring, the cache and pod logs answer once — the page says which). Every source says the window it really holds (the page's range, back from now, the ring, the cache). Up to 7 d.
- Traces — its own service, or the services on a pod / node / VM / database (≤ 3; a host asks you to pick a VM), p50 / p95 / max against the usual for this weekday and hour, ≤ 40 traces and the span waterfall. Trace backends read back from now: a window that ended a while ago lists only what they still return inside it, and one that starts more than 7 d back says its older part was not searched. Up to 7 d.
- Flows — a service's flow peers, then for each of its addresses (a pod IP, a node's or VM's addresses, a management IP) the Flows tab's pair query over the window, 200 rows and Load more. Up to 30 d.
- Events & changes — alerts, changes, activity, findings, kernel crashes, vCenter events and traps over the window (the newest 50 a source, ≤ 200 in all — when more were found the page says how many), your open problems on it (≤ 20), the vCenter timeline of its VM or host; Kubernetes, Dynatrace and Zabbix are read live only when you switch them on. Up to 30 d.
- Hardware — the ESXi host's NICs and VMs (live from vCenter), the iLO / iDRAC / XCC controller's hardware link and live sensors, the warranty on record, and the Hypervisors findings on it.
Where it runs
Right after Figures, the entity's page lists everything it runs on — Pods, K8s nodes, VMs, ESXi hosts, Datastores, Devices · iLO — one compact table per layer in chain order, each row with its live figures (a pod's CPU and memory of its limit, restarts and status; a VM's CPU, active memory, CPU ready, disk latency and network; a host's CPU, memory, network and controller health; a datastore's use, latency and IOPS; a controller's health, temperatures, fans and power supplies and power draw). One read asks for all of them (≤ 300 cards, again on Refresh and every 30 s while the tab is visible); rows sort worst first, a layer shows 20 until Show all, and a figure nothing measured is a hollow dot with the reason on hover — never 0. Selecting a row — or a hop of the header's chain — opens its figures inline under it, the same tiles as its own Figures; only Drill down › opens its own page, and the header's ← <the entity you came from> returns to it. The Figures card's Runs on line counts them (“16 pods · 4 nodes · 4 VMs · 3 hosts · 3 controllers”) and opens this section.
RECAP problems
When a RECAP integration is visible to you (yours, or shared with your organisation — never another organisation's), a service, pod, Kubernetes node, VM, ESXi host or database page gains RECAP problems: the problems RECAP lists for the service — its own name and its Catalogue aliases — or, on a pod / node / VM / host / database, for the services that run on it (≤ 10, by name). Without one there is no section, no tile and no sentence. A line sums it up (3 open · 12 resolved in the last 24 h · from RECAP Prod), then one row per problem — open ones first, then the most recently seen, ≤ 100: the status (open · acknowledged · resolved), RECAP's severity, the title, the services involved, first → last seen in your clock, the change RECAP suspects (or its triage note), Chain (RECAP's blast-radius graph and the cross-service log flow of the newest occurrence) and Post-mortem when RECAP wrote one; Show older adds the resolved ones last seen before the window. A problem counts for the window when it was active during it or is still open (RECAP resolves a problem by itself once it stops recurring). Figures gets a RECAP: N open problems tile (hollow until RECAP answered, with why when it was not searched) and the counts in What it is; Events & changes marks each problem opened or resolved inside the window, from the same read. RECAP lists problems without a service filter, so the server reads its newest 500 problem types once per integration and keeps them 60 s for every page (a failure 15 s), plus the newest occurrence and post-mortem of the first 10 listed; each read is one live read (≤ 3 RECAP integrations a page) recorded in the activity log, and the text is redacted with the integration owner's rules. A RECAP reached through a proxy needs proxy 1.241.0 or later — an older one is named, never asked. Up to 90 d.
Query builder
It starts from the entity on the page and never asks for it again. Two tabs — Builder opens first:
- What — Logs · Traces · Events · Flows · Metrics, only the kinds this entity has a readable source of. One click reads the newest 100 about the entity over the page's range; a kind with more than one source gets a picker, pre-set to the one the Figures count. Every pick is narrowed to the entity — the server adds its service, host, pod, address or trace keys — and shows as about <name>; widen drops that for one kind;
- Filter — one line per kind: contains text… with All · Warn+ · Errors for logs (the Logs section's meaning — Errors is the source's own error query), errors only for traces, severity for events, port and peer for flows. More filters unfolds field · operator · value rows (up to 12); a field offers only its own operators, and a row the backend cannot apply is checked after the read;
- Combine — appears with a second kind (up to 4): one sentence such as “match Logs to Traces by trace id”, pre-chosen from the pair — by trace id, by address (either end of a flow), by service, by time within 1, 5 or 15 min — with keep unmatched for the first kind's rows that find no partner;
- a problem is said once, beside what it is about, and goes the moment you fix it; Run stays off while one remains. Before the first run the results area says what to do — never an empty table;
- results: a line per kind (“Logs · Prod Graylog · 100 of 1,240 lines in 9 s · Views search”), then Table · Timeline · Histogram and Group by (1 min · 5 min · 15 min · 1 h with count, sum, avg, min or max) and CSV. How it will run shows the plan — the native query of each kind, what the entity added, which side runs second with up to 50 keys from the other — and the run record;
- at most 5,000 rows a kind and 2,000 matched rows, 30 s a kind inside 60 s for the whole run, 8 live reads a run (the defaults — Admin → Forensics changes them); a time match that would compare more than 1,000,000 row pairs is refused (narrow the range or match on a key);
- Advanced (Lucene · SQL · PromQL) runs one source in its own language — Graylog Lucene or Elasticsearch / OpenSearch Lucene (the integration's index patterns, ≤ 1000 lines with a histogram; KQL is not accepted) over the page's window, PromQL, a metric expression over the stored rollups, read-only SQL on the flow warehouse when its proxy allows it — and shows what actually ran; logs, traces, events, network flows and the fixed database diagnostics show their filter as real controls (errors only, slower than … ms, severity, mode) whose chips set a field.
Ask the bot
The monitoring bot answers questions about the entity on the page — without a board: it works over your own integrations and the ones shared with your organisation, as you, with the same tools it uses on a board (logs, traces, events, network flows, metric history, what changed, open problems, database diagnostics, resolving a name or an address). The page tells it which entity and which window you are looking at. While it works, each tool it calls appears as a chip; under the answer, Evidence shows every tool result as a table or a chart.
- It runs on your organisation's Assistant model (Organisation → AI models); without one, Ask says so.
- At most 20 messages of up to 8,000 characters go with a question; this browser keeps the last 40 per entity (New conversation clears them).
- Up to 8 tool-using turns and 8 live reads an answer, 50 asks per organisation in 24 hours — if that count cannot be read, Ask waits rather than running uncapped; one question at a time per person (the defaults — Admin → Forensics changes them).
- Live reads are for everyone who can see the entity; running a diagnostic on a network device is offered only to the organisation's owners and admins, or to whoever owns every integration the entity's sources come from.
- What goes to the model and every tool result shown under the answer pass your organisation's redaction rules first; each ask is kept in the run audit with the tools it called and the tokens it used.
Who sees what, and the cost
Everyone who can see the entity gets the same page, live reads included. An entity outside what you can see answers exactly like one that does not exist. One case reads stored data only: a source whose integration reached you through a board you may open but is not yours or shared with you — that source says so in one line and is not searched live. Each request may make at most 4 live reads for logs, 3 for events and 2 for traces, each one recorded in the activity log as forensics.live_read (never listed as a change); each person may complete 10 requests a minute per section; changing a filter while a read runs cancels it and the newer one goes ahead (more than that answers “still reading the previous window — try again in N s”).
Good to know
- Sessions use the modern
/api/sessionendpoint (vCenter 7.0 U2+) with an automatic fallback to the legacy/restone; real-time utilization comes from the SOAP Performance Manager — 5-minute averages plus peaks, so bursty VMs the average hides still show up. - vSAN gets its own dedicated rollup and is excluded from the Storage aggregate by default — counting it twice would distort hybrid-cluster percentages; picking the vSAN datastore explicitly re-includes it.
- Datastore latency, IOPS and throughput (server 1.367.0): a VMFS / NFS datastore’s figures are its mounting hosts’ datastore counters (QueryPerf, 5-minute means). A vSAN datastore has none — ESXi reports no datastore counters for vSAN — so its figures are the vSAN cluster’s front end (read / write latency, read / write IOPS, read / write throughput), from the vSAN read the Hypervisors collector already makes for every vSAN cluster every 10 minutes (no extra vCenter call). They show on Infrastructure → Hypervisors → Datastores, on the Forensics page’s Where it runs dots and in its Metrics (hourly, kept 35 days). This needs the vSAN performance service on — vCenter → the cluster → Configure → vSAN → Services → Performance service. When vSAN answers without front-end figures the datastore says so (“the vSAN performance service may be off”) instead of a 0.
- Alarms collapse vSphere status to severity (red → critical, yellow → warning); acknowledged and informational (green/gray) alarms are not surfaced.
- Every triggered alarm is a hardware finding on the thing it is about (server 1.288.0): a VM, host, datastore or the cluster itself — the Hypervisors page lists it on that row, in Findings and in Alarms, attributed to its cluster (“VM PostgreSQL_PG15 · cluster vcsa_8.0.3 · since …”), and it can be snoozed like any finding. It resolves on its own once vCenter clears the alarm; an alarm acknowledged in vCenter is left out (someone already owns it). Fleet alerting notifies about these only when Triggered vCenter alarm is picked by name — the Alarms source already alerts on the count.
- Cluster and Alarms sources are hardware, not services. They are named after the cluster’s display name (vcsa_8.0.3 · Alarms) — never its
domain-c…id — and no longer create a catalogue service or feed a service’s health; an olderdomain-c…service is retired by the next catalogue sweep and health fold. On the Alerts page the Alarms source’s count is one Hardware row, “Prod vCenter · Cluster vcsa_8.0.3 · 2 critical alarms”, whose Open goes to Hypervisors → Alarms narrowed to that cluster and whose reasons are the alarms themselves. - One vCenter session per integration (proxy 1.204.0 / server 1.259.0): every source, alarm read and fleet read of a vCenter shares one login, one counter map and a keep-alive connection pool for 25 minutes, so a poll neither logs in nor re-downloads the performance-counter catalogue. Poll VMware sources every 30 s or slower — vCenter’s realtime statistics are 20-second samples and each poll reads the last 5 minutes. Sizing: Proxy requirements and sizing.
- Network: vSAN vs VM (proxy 1.231.0 / server 1.342.0): on Infrastructure → Hypervisors → Hosts, grouped by cluster, every host’s Network column reads three figures — “982.6 MB/s · vSAN 765.3 · VMs 180.1”: the host’s total over every vmnic (rx + tx, the 60-second read), its vSAN backend traffic (the vSAN performance service’s
vsan-host-netentity — the 15-minute mean, the same figure the NICs drawer shows) and the sum of its powered-on VMs. The tooltip adds the residual — other = total − vSAN − VMs: management, vMotion, NFS / iSCSI — and vSAN’s in / out split. Each cluster’s header (and its row on Clusters) carries the same subtotals, marked partial when a host had no figure; the host and cluster expansions draw 7-day vSAN network and VM network sparklines beside CPU and memory (hourly means, kept 35 days). The vSAN figure is read on the 5-minute configuration pass — oneVsanPerfQueryPerfper vSAN cluster — and needs proxy ≥ 1.231.0 for proxy-polled vCenters; an older proxy shows “—” with that hint. A host without vSAN, or a cluster whose vSAN performance service is off, shows “—” with the reason, never 0. VMs read “—” in the collector’s light mode (no per-VM figures). - Host logs (server 1.294.2): per-host log error baselines for every ESXi host and vSAN cluster of this vCenter, read from the error counts the Hypervisors page already collects from Aria Operations for Logs — zero extra Logs calls, server-side only, poll every 300 s or slower. The value is the 15-minute count scaled to the interval (an estimate; exact at 900 s); silent hosts read 0, hosts the appliance did not answer for are left out and named; types are approximate (fingerprints of the ≤ 5 newest error lines per host). Needs an Aria integration visible to the vCenter’s owner and the Hypervisors collector on. Details: Aria Operations for Logs.
More Infrastructure & Networking integrations
See it on your own infrastructure
Book a demo and we will walk you through Topologix with your systems in mind: on our cloud, or self-hosted in your own network.