AWS EC2 monitoring with Topologix
Infrastructure & Networking
Per-instance EC2 health from CloudWatch — CPU utilization, network in/out, disk read/write, and the status-check-failed flag — plus live instance state and metadata from the EC2 API, one card per instance.
Requirements
- An IAM user with
AmazonEC2ReadOnlyAccess+CloudWatchReadOnlyAccess(minimum permissions:ec2:DescribeInstances,cloudwatch:GetMetricData) and an access key. - Server-side only — AWS APIs are public endpoints, so no proxy agent is involved. One integration covers one region; add another for other regions.
1 · Set up the integration
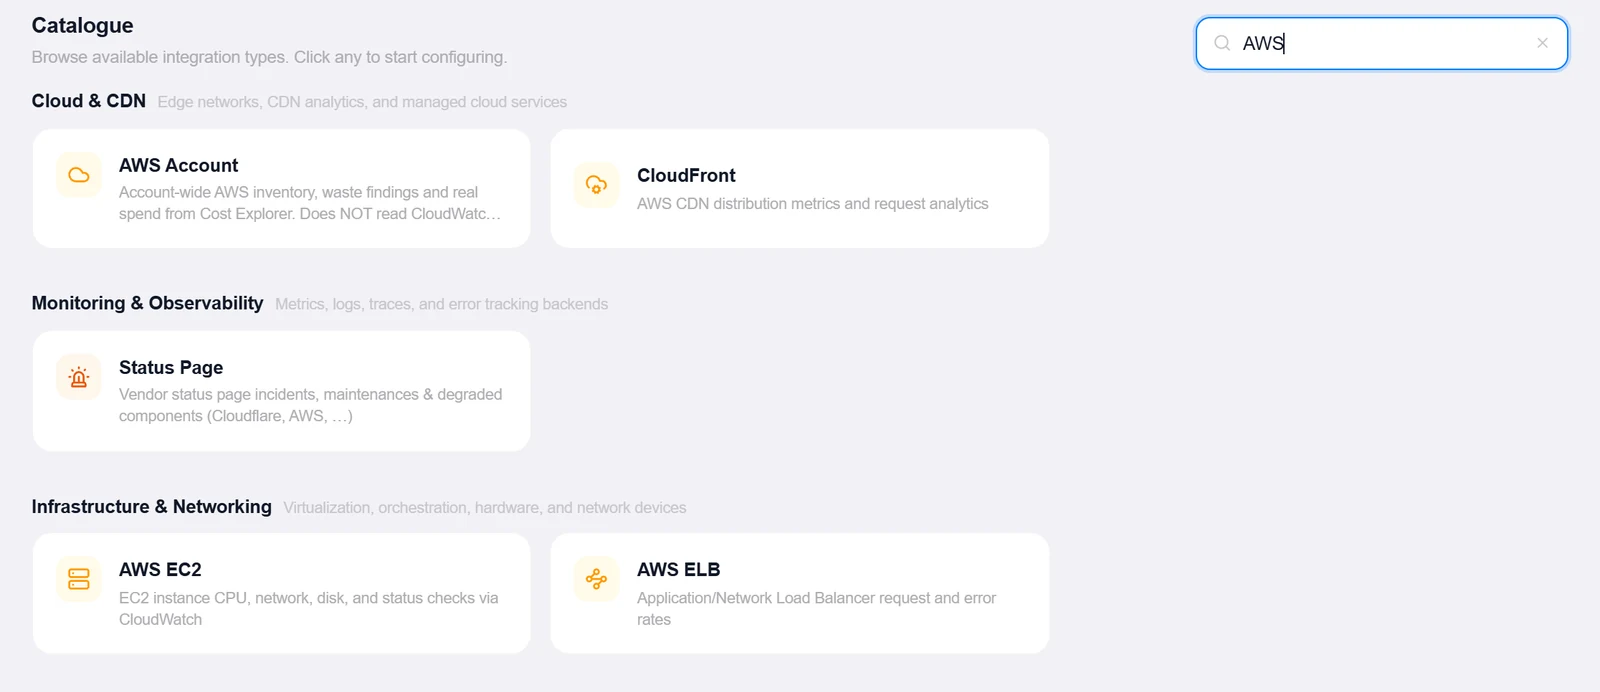
- Open the Integrations pageClick Integrations in the toolbar and pick AWS EC2 from the catalogue.
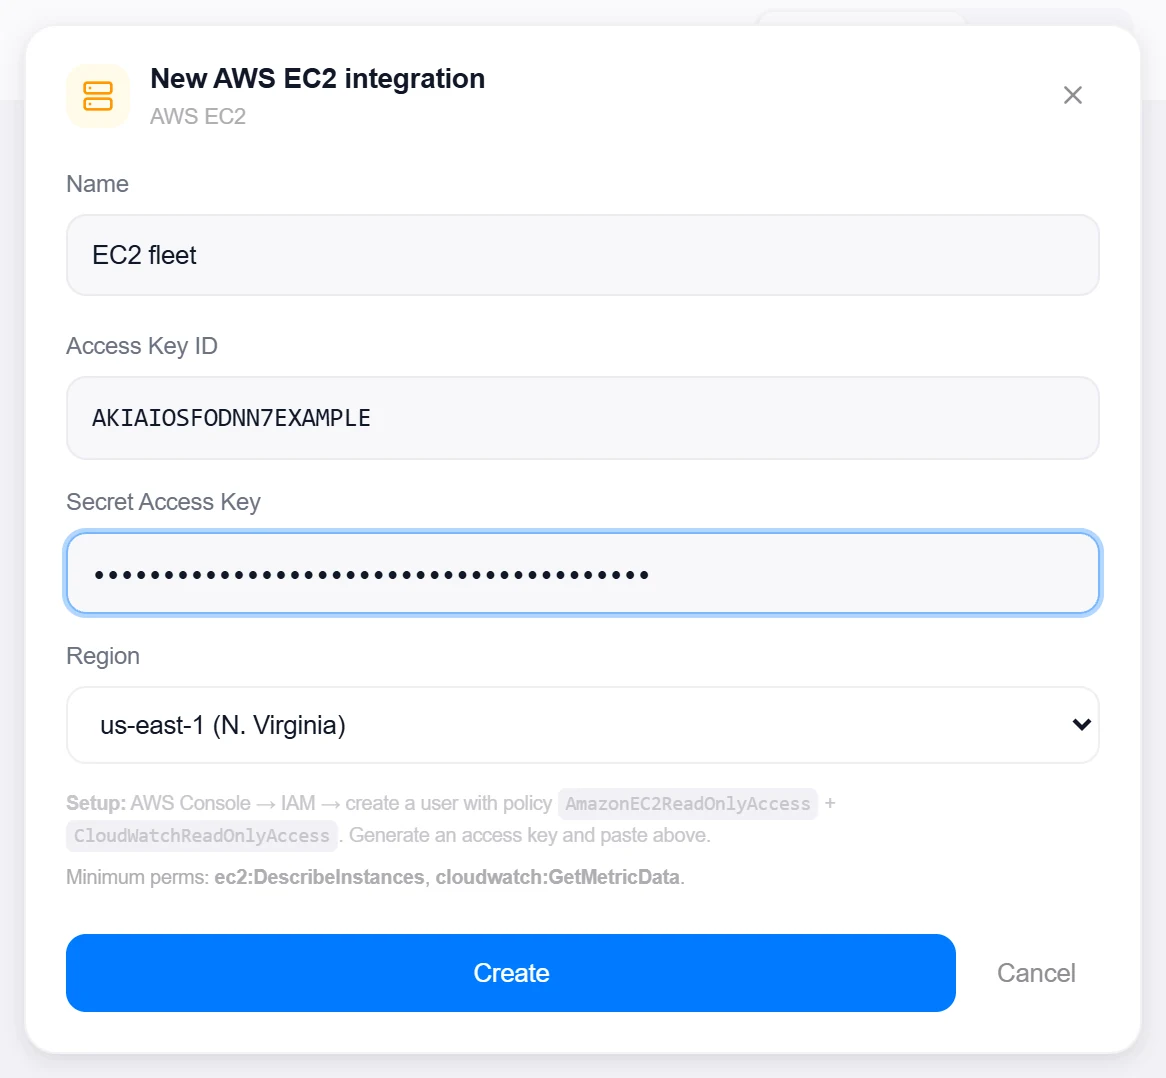
- Create the IAM userAWS Console → IAM → create a user with
AmazonEC2ReadOnlyAccessandCloudWatchReadOnlyAccess, then generate an access key. - Enter credentials and regionAccess Key ID, Secret Access Key, and the Region picker (16 regions, us-east-1 through sa-east-1).
- Create, then verifyClick Create, then reopen the integration and click Test — it lists instances and reports how many are visible in the region; bad credentials and missing IAM permissions come back as named errors.
Target on a private network? Route it through a proxy agent. Proxy agents run inside your network — behind NAT, on a management VLAN, in an air-gapped segment — and reach targets the Topologix server can't. The agent polls the server every 15 seconds for its assignments, runs the checks locally, and pushes results back every 5 seconds, so no inbound firewall rules are ever needed. Set a default proxy on the integration; every metric source can override it. If a proxy goes offline, its sources are marked stale within ~90 seconds and the last known values stay visible.
2 · Add it to a flow
- Select the server nodeClick the node, open Metrics, then + Add and choose the EC2 integration.
- Pick instancesThe discovered list shows every instance with name, state, type, and availability zone. Multi-select fans out one source per instance.
- Choose the period and savePeriod is the CloudWatch granularity — 1 minute, 5 minutes (the default), 1 hour, or 24 hours. Click Add Source; the card shows CPU %, network and disk throughput, status checks, and the instance’s live state.
Live canvas screenshots for this integration require a real AWS EC2 environment, so this guide shows the configuration screens only — the flow steps above work exactly like every other integration.
Good to know
- Each poll queries a window of two periods back because CloudWatch datapoints for EC2 arrive with a ~1–3 minute lag — the card always shows the latest completed datapoint, never a partial one.
- The 1-minute period only returns data for instances with detailed monitoring enabled; basic monitoring publishes at 5-minute granularity.
StatusCheckFailedrides along as a 0/1 value (the maximum over the period), so a threshold on it alerts on instance/system check failures directly.
More Infrastructure & Networking integrations
See it on your own infrastructure
Book a demo and we will walk you through Topologix with your systems in mind: on our cloud, or self-hosted in your own network.