HPE Aruba monitoring with Topologix
Infrastructure & Networking
One integration, four Aruba management surfaces picked at setup: Aruba Central (cloud) for fleet-wide switch/AP/gateway/client health, an AOS-CX switch’s REST API for device health, a Mobility Controller/Conductor for AP and cluster state, or ClearPass for cluster and authentication health — all normalized onto one “needs attention” metric so a single alert rule works whichever surface you point at.
Requirements
- Central: the region-specific API Gateway Base URL (Central → Global Settings → API Gateway) and API credentials with read scope on Monitoring — client ID/secret, an offline (refresh) token, or a pasted access token.
- AOS-CX / Controller / ClearPass: HTTPS reach to the appliance — these modes always speak TLS, with a self-signed toggle — from the server or a proxy agent via the per-source Run on picker. AOS-CX needs its REST API enabled (read-only mode is enough); ClearPass needs an API client with the client_credentials grant.
1 · Set up the integration
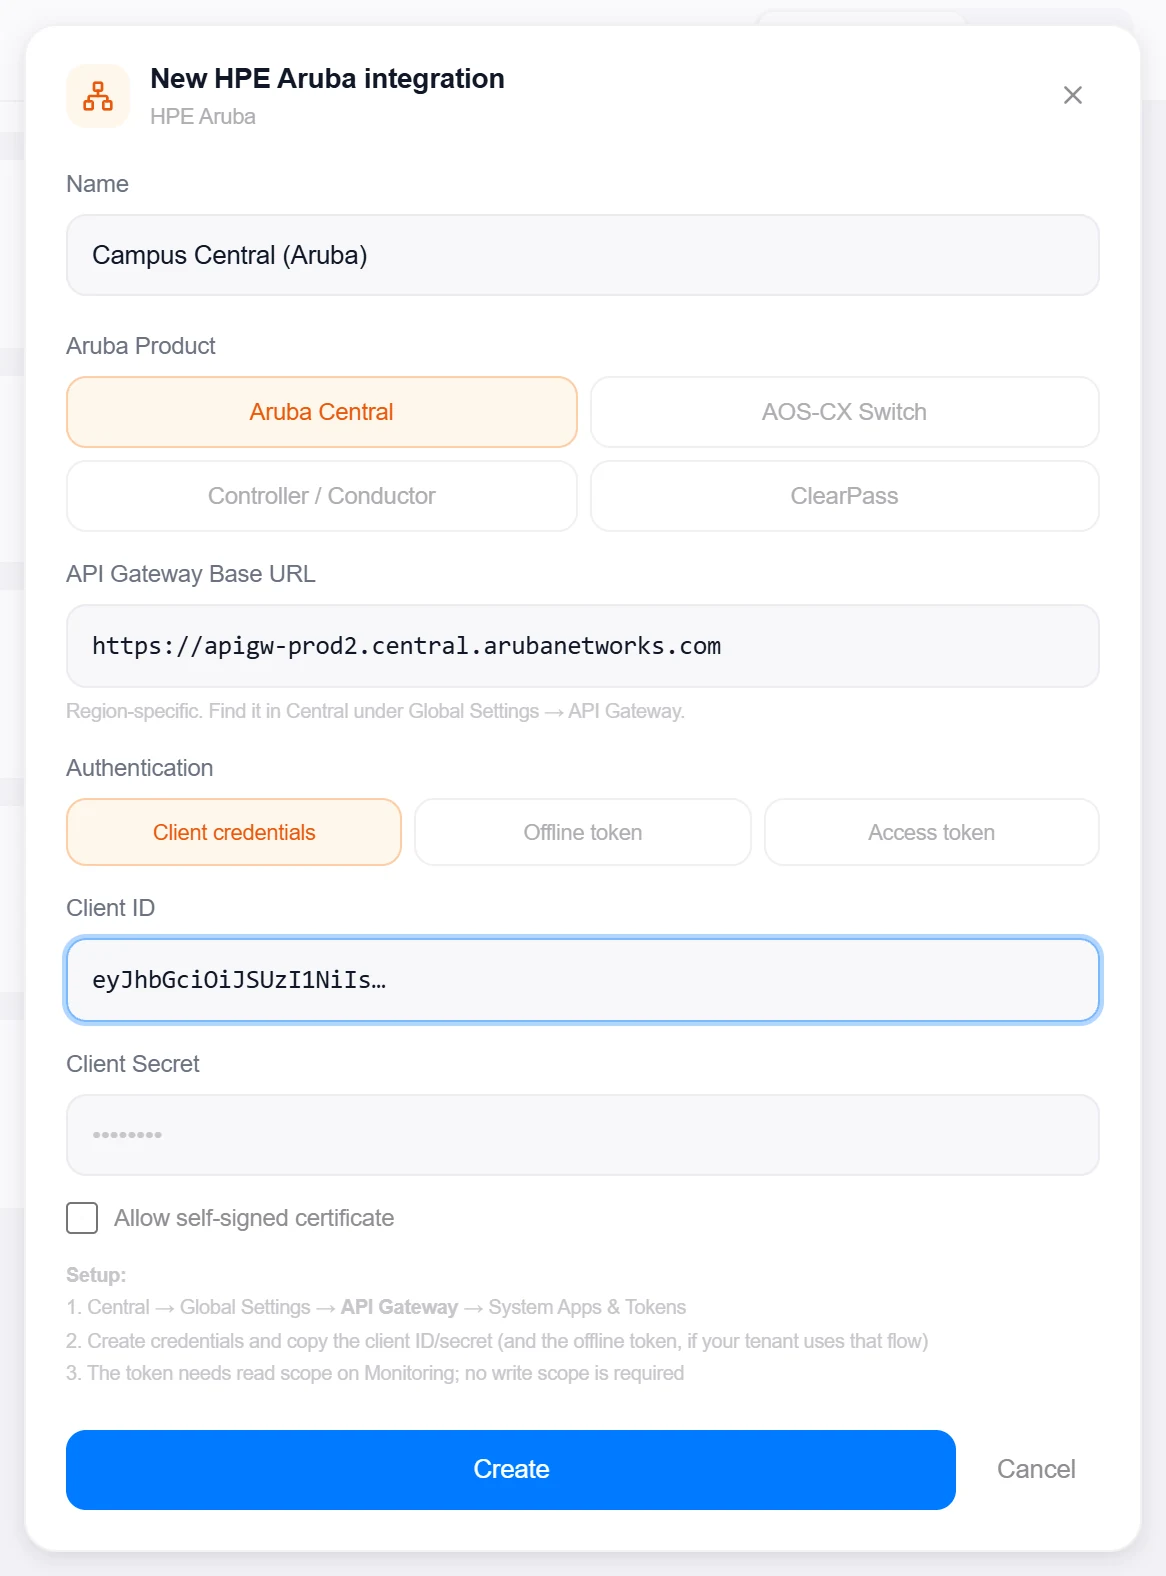
- Open the Integrations pageClick Integrations in the toolbar and pick HPE Aruba from the catalogue.
- Pick the Aruba productFour tiles: Aruba Central, AOS-CX Switch, Controller / Conductor, ClearPass. The choice fixes what this integration monitors — one integration per surface.
- Enter the credentialsCentral: base URL plus one of Client credentials, Offline token, or Access token. AOS-CX and Controller: host, Username, Password (the controller defaults to port 4343 — append
:443to override). ClearPass: host, API Client ID, Client Secret. - Create, then verifyClick Create, then reopen the integration and click Test. Central reports the auth mode and how many switches are visible; AOS-CX reports hostname, platform, and software version via the negotiated REST version; Controller reports the ArubaOS version; ClearPass reports its cluster node count.

Target on a private network? Route it through a proxy agent. Proxy agents run inside your network — behind NAT, on a management VLAN, in an air-gapped segment — and reach targets the Topologix server can't. The agent polls the server every 15 seconds for its assignments, runs the checks locally, and pushes results back every 5 seconds, so no inbound firewall rules are ever needed. Set a default proxy on the integration; every metric source can override it. If a proxy goes offline, its sources are marked stale within ~90 seconds and the last known values stay visible.
2 · Add it to a flow
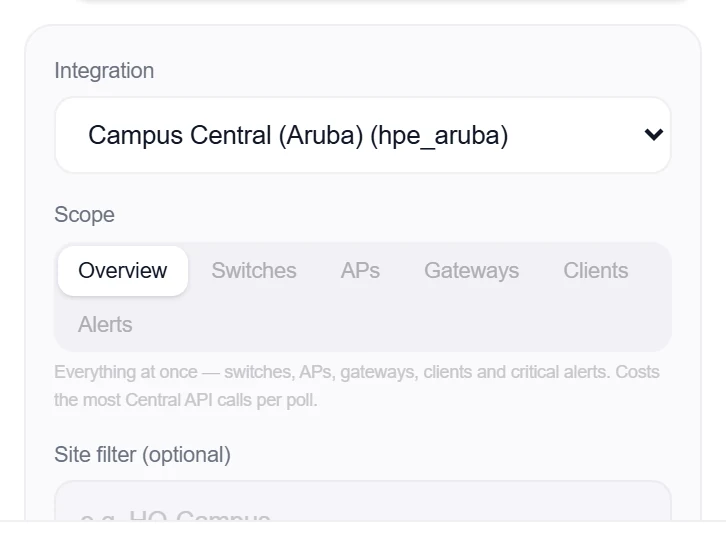
- Select the network nodeClick the node, open Metrics, then + Add and choose the Aruba integration.
- Scope it (Central only)Central sources pick a Scope — Overview (everything at once, the most API calls per poll) or just Switches, APs, Gateways, Clients, or Alerts — plus optional site and group filters. The three appliance modes have nothing to scope: one card is the appliance’s full health summary.
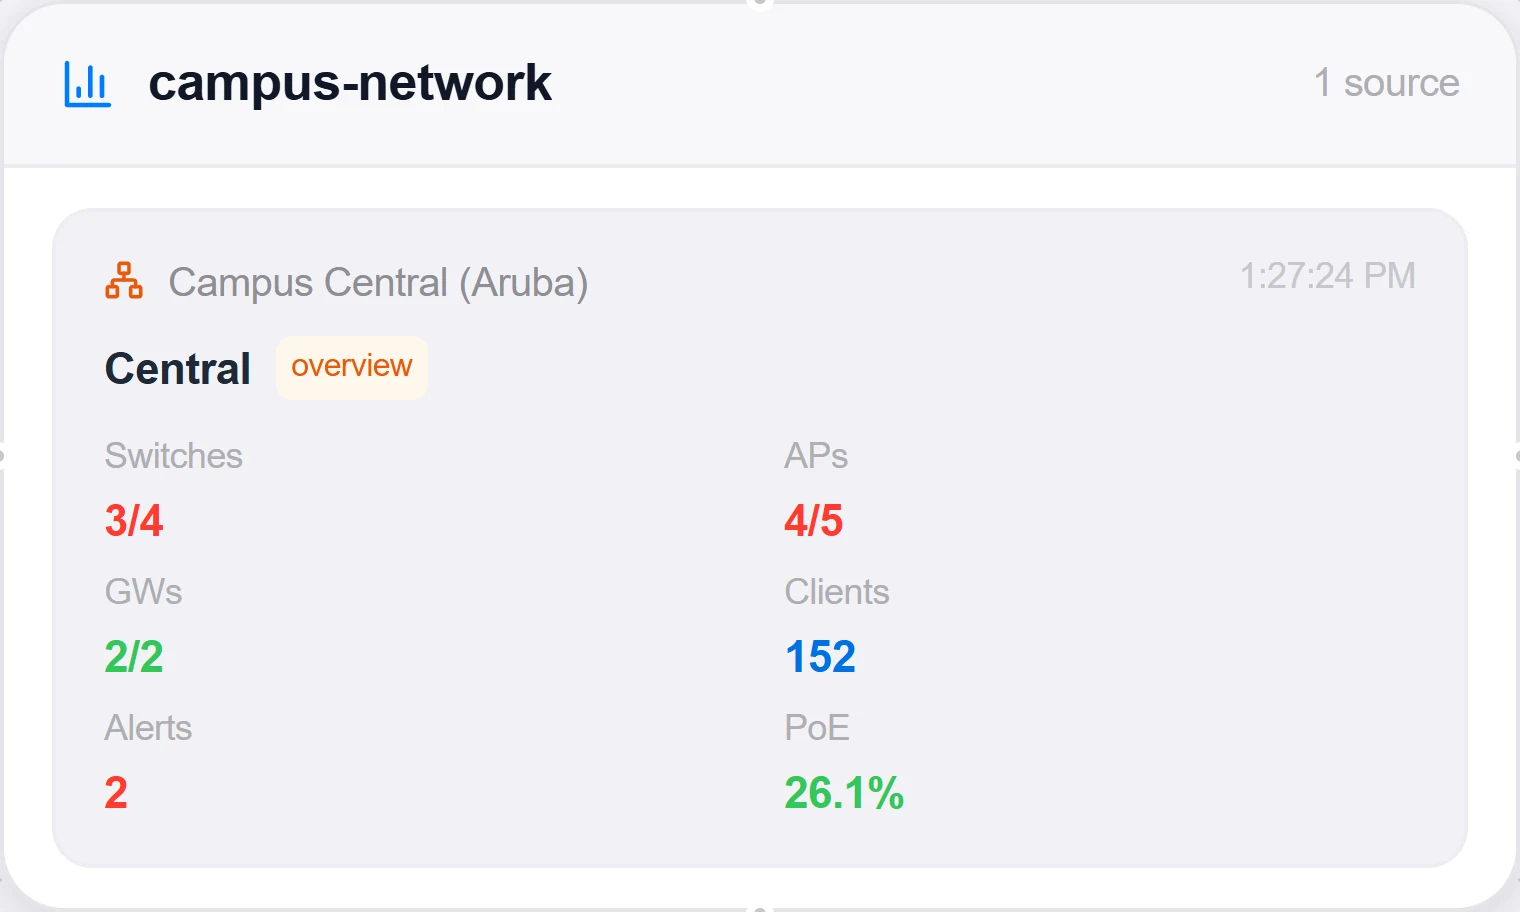
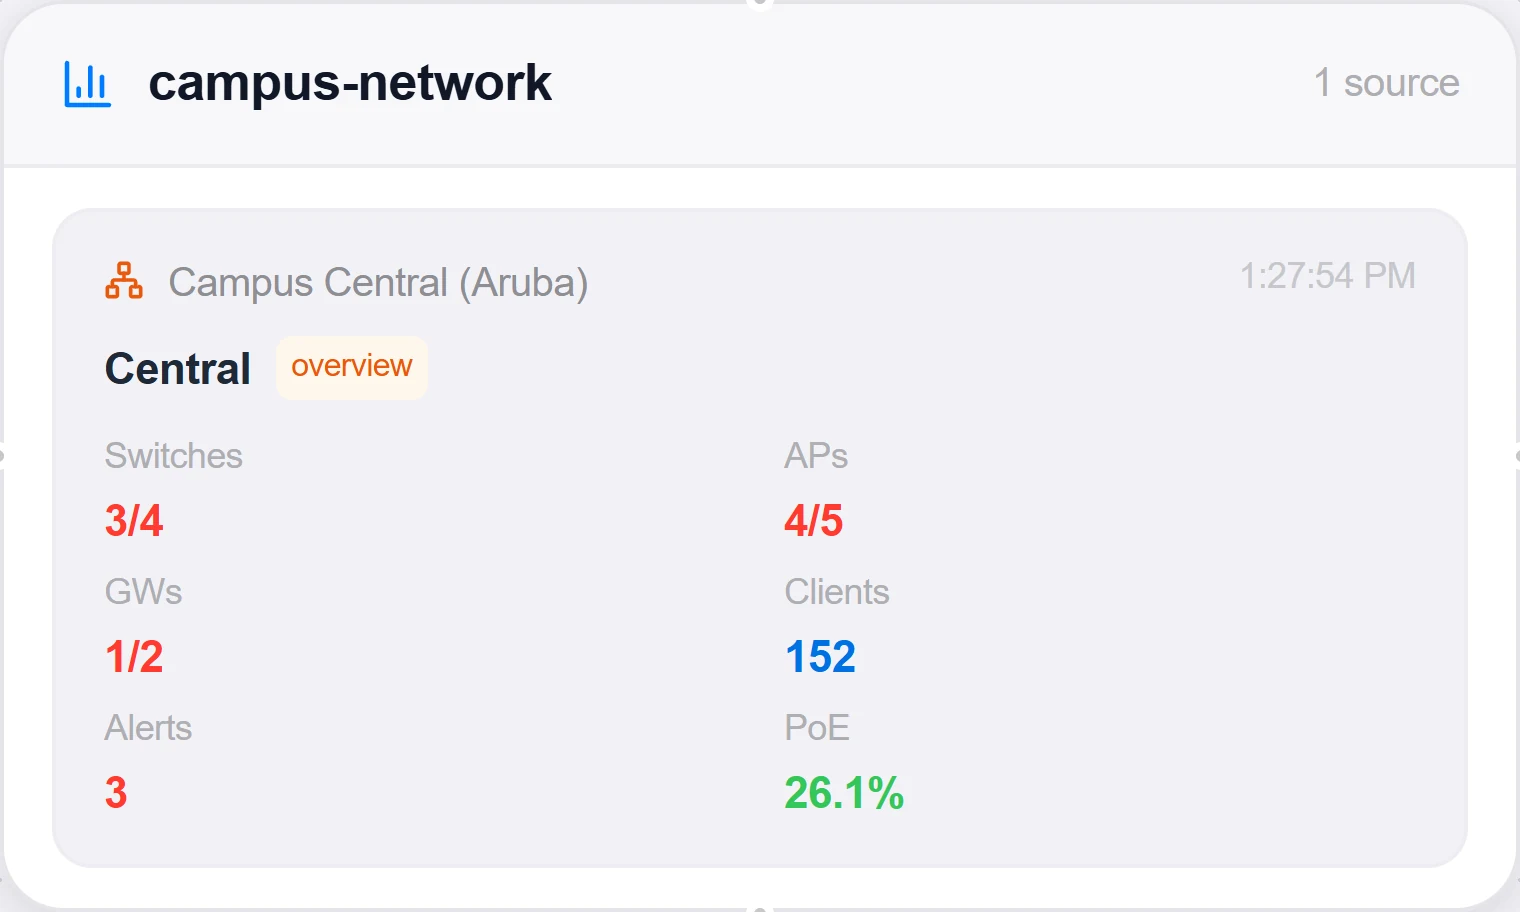
- SaveSet the interval and click Add Source. Central shows switches/APs/gateways up vs down, wireless and wired clients, critical alerts, and PoE utilization; AOS-CX shows CPU, memory, temperature, PSU/fan health, port up/error counts, and PoE; Controller shows CPU/memory, APs up/down, clients, and cluster state; ClearPass shows cluster nodes, active sessions, endpoints, and enabled/disabled services — each with a “needs attention” list of the specific offenders.
Good to know
- Central offline tokens are single-use: every refresh issues a new one and kills the old. Topologix persists each rotation automatically, which pins all of that integration’s sources to one collection location and means re-pasting the token field resets the rotation chain. Prefer client credentials where your tenant allows it.
- Every mode emits the same
attentionCount, and the default alert rule (“Devices needing attention”) rides on it — one rule covers Central fleets and single appliances alike. - AOS-CX REST version negotiation is automatic (v10.09 → v10.08 → v10.04), and appliance logins are opened and closed per poll.
More Infrastructure & Networking integrations
See it on your own infrastructure
Book a demo and we will walk you through Topologix with your systems in mind: on our cloud, or self-hosted in your own network.