MOXA ioLogik I/O monitoring with Topologix
Infrastructure & Networking
Industrial digital I/O monitoring for MOXA ioLogik universal controllers — breakers and binary sensors wired to the unit’s DI/DO channels, each compared against an operator-defined EXPECTED state every poll. Connection and credentials live on the integration; each physical unit is its own metric source addressed by IP, over a choice of three transports.
Requirements
- A MOXA ioLogik unit (E1200 series or compatible) speaking one of three transports: the RESTful JSON API (the default — plain HTTP on port 80 unless the unit has TLS), Modbus TCP (port 502), or SNMP v1/v2c (port 161).
- Network reach to each unit from the Topologix server or — typical for an OT/industrial segment — a proxy agent inside that network, picked per source under Run on.
1 · Set up the integration
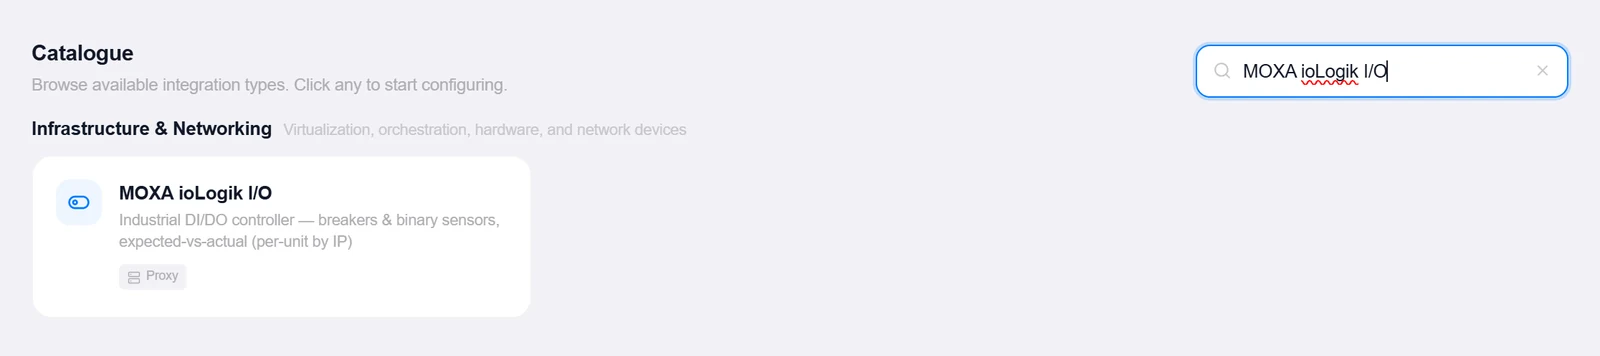
- Open the Integrations pageClick Integrations in the toolbar and pick MOXA ioLogik I/O from the catalogue.
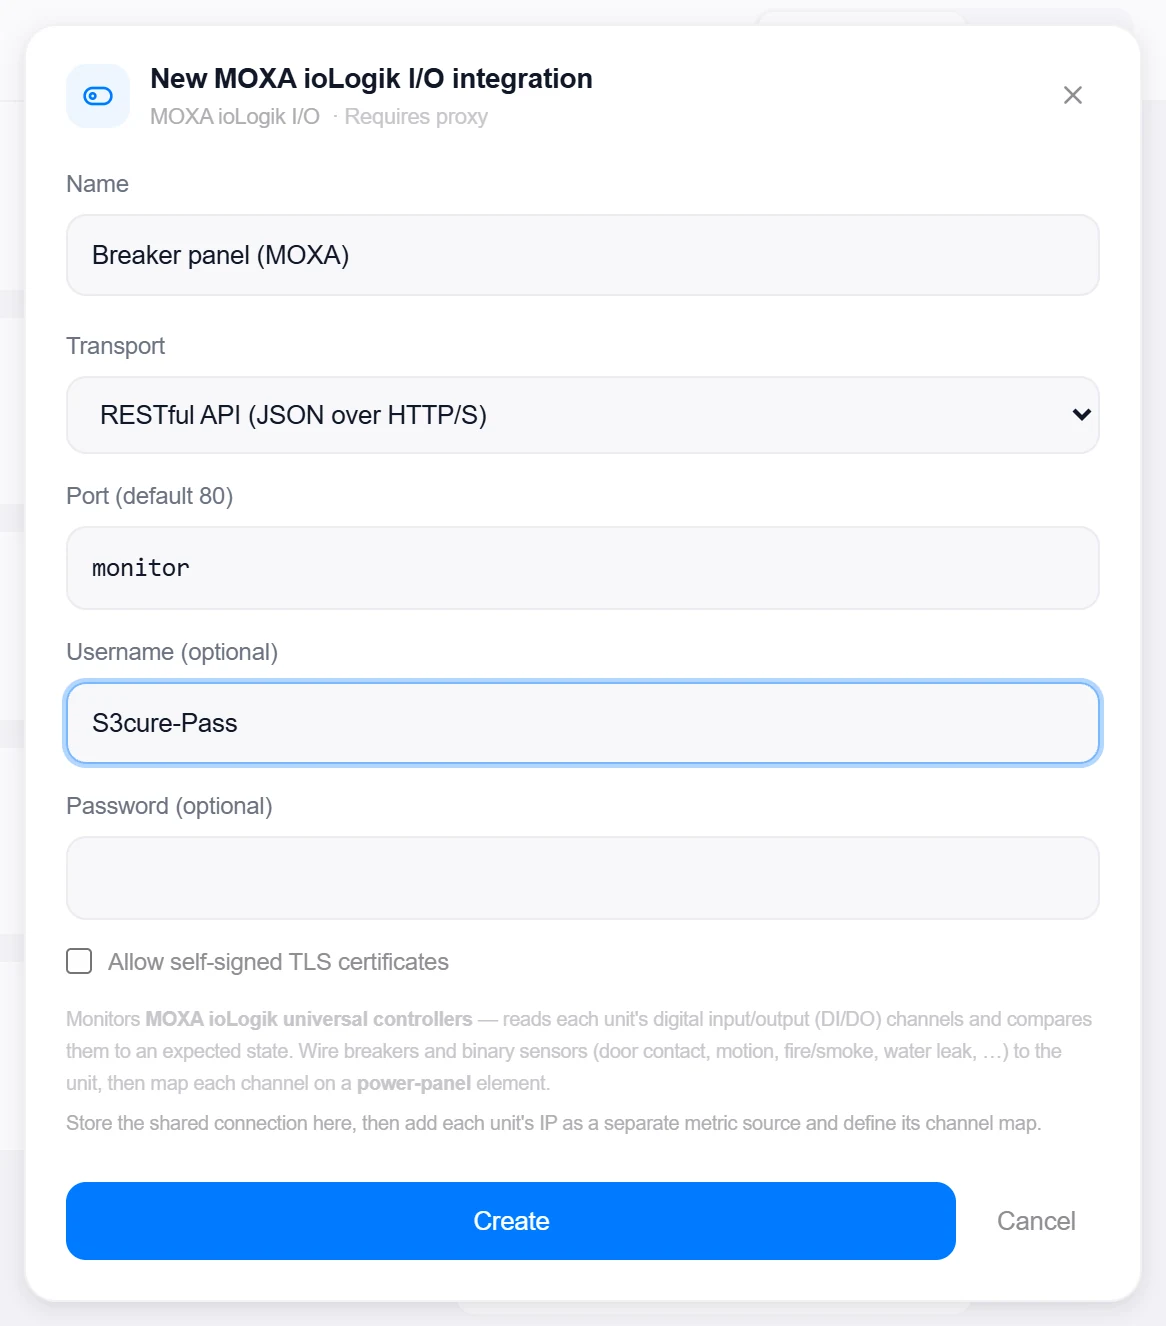
- Choose the transportRESTful API (JSON over HTTP/S), Modbus TCP, or SNMP v1/v2c, plus an optional Port override. REST adds optional Username/Password and an Allow self-signed TLS certificates toggle; SNMP adds the Community and the model-specific DI base OID / DO base OID from your unit’s MIB; Modbus adds the Unit / slave ID.
- Create, then verifyClick Create, then reopen the integration, enter any unit’s IP under Test unit, and click Test — it reads the unit and reports the device name plus how many DI/DO channels it saw. The test host isn’t saved: individual units live on the metric sources.
Target on a private network? Route it through a proxy agent. Proxy agents run inside your network — behind NAT, on a management VLAN, in an air-gapped segment — and reach targets the Topologix server can't. The agent polls the server every 15 seconds for its assignments, runs the checks locally, and pushes results back every 5 seconds, so no inbound firewall rules are ever needed. Set a default proxy on the integration; every metric source can override it. If a proxy goes offline, its sources are marked stale within ~90 seconds and the last known values stay visible.
2 · Add it to a flow
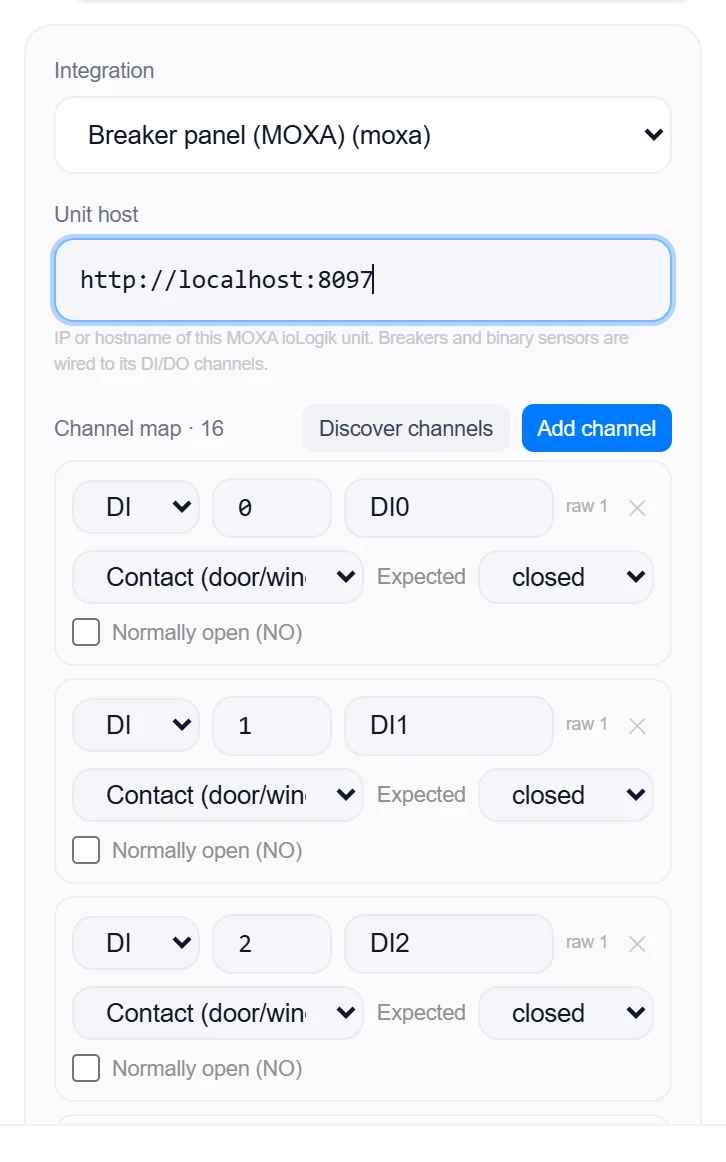
- Select the panel nodeClick the node — or a power-panel breaker/sensor element, which binds exactly one channel — open Metrics, then + Add and choose the MOXA integration. Enter this unit’s IP or hostname.
- Map the channelsClick Discover channels to list the unit’s DI/DO channels with their live raw values, then give each a name, a type (Breaker, Contact, Motion, Fire/smoke, Water leak, Gas, Glass break, Panic, Generic) and its Expected state. Sensors get a Normally open (NO) wiring toggle; a breaker can take a second Trip channel (DI) that gives it a distinct tripped state.
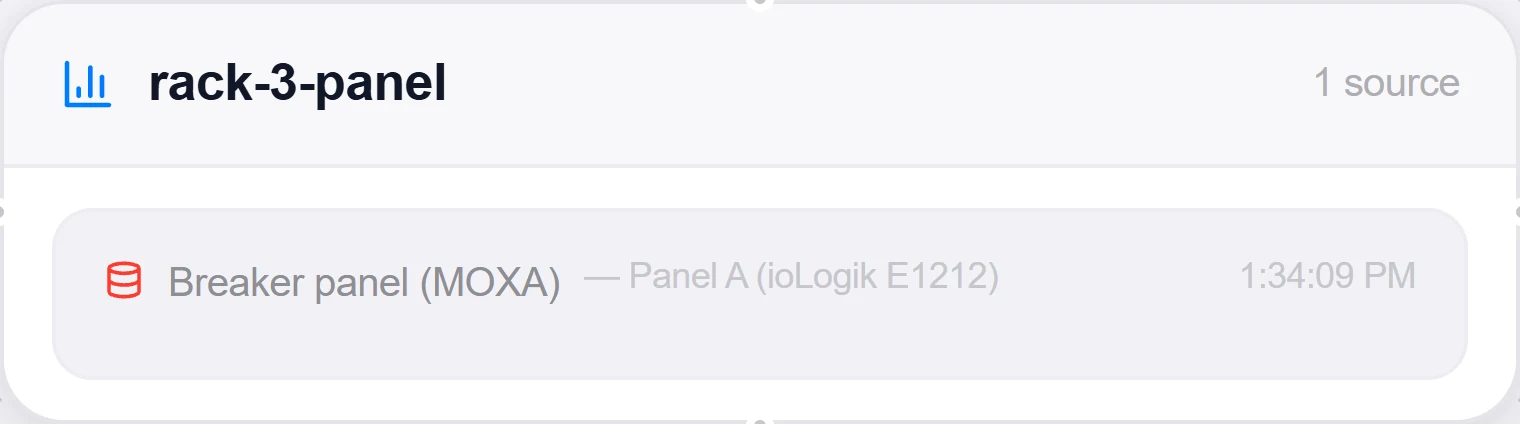
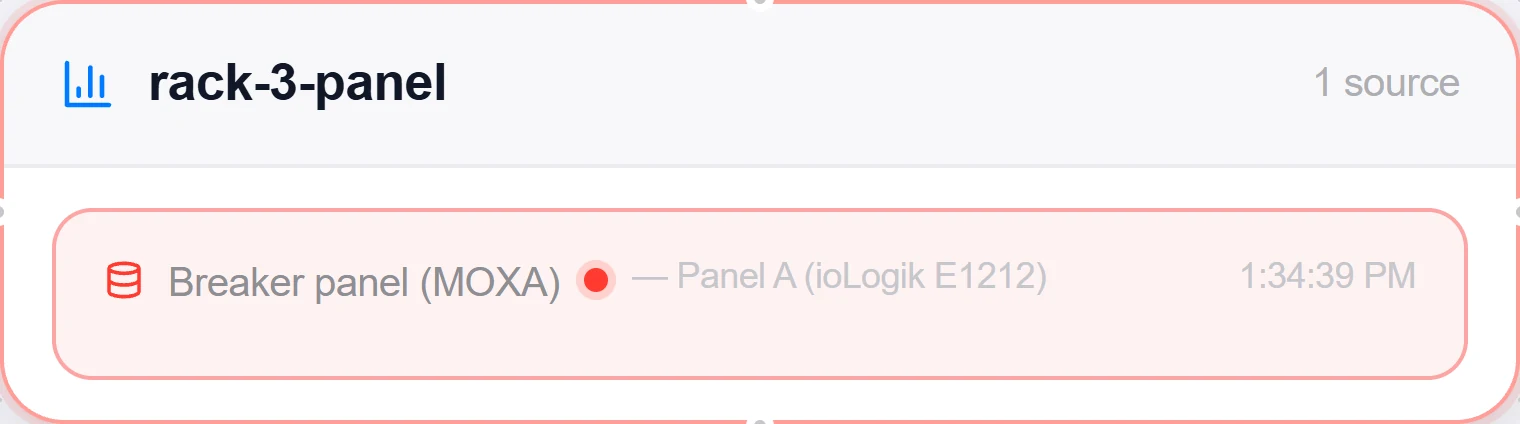
- SaveSet the interval and click Add Source. The card shows every channel’s expected-vs-actual state and the mismatch count; any channel out of its expected state flips the source to error.
Good to know
- A transient read failure reports a channel as unknown, which never counts as a mismatch — a unit briefly dropping off the network doesn’t trigger an alarm storm.
- Modbus has no channel directory, so Discover channels probes a default 16 DI + 16 DO; REST and SNMP list exactly what the unit reports.
- A tripped breaker (trip contact asserted) is its own state: it turns the card health to warning even when no expected-state mismatch exists.
More Infrastructure & Networking integrations
See it on your own infrastructure
Book a demo and we will walk you through Topologix with your systems in mind: on our cloud, or self-hosted in your own network.