DNS Probe monitoring with Topologix
Infrastructure & Networking
Synthetic DNS monitoring with zero backend — every configured resolver is queried independently each poll, measuring resolution success and latency, validating expected answers, comparing SOA serials across the pool for zone convergence, and probing the TCP/53 listener.
Requirements
- UDP and TCP reach on port 53 from the Topologix server — or a proxy agent for LAN-only resolvers and internal zones.
- No credentials and nothing to install — it speaks the plain DNS wire protocol.
1 · Set up the integration
- Open the Integrations pageClick Integrations in the toolbar and pick DNS Probe from the catalogue.
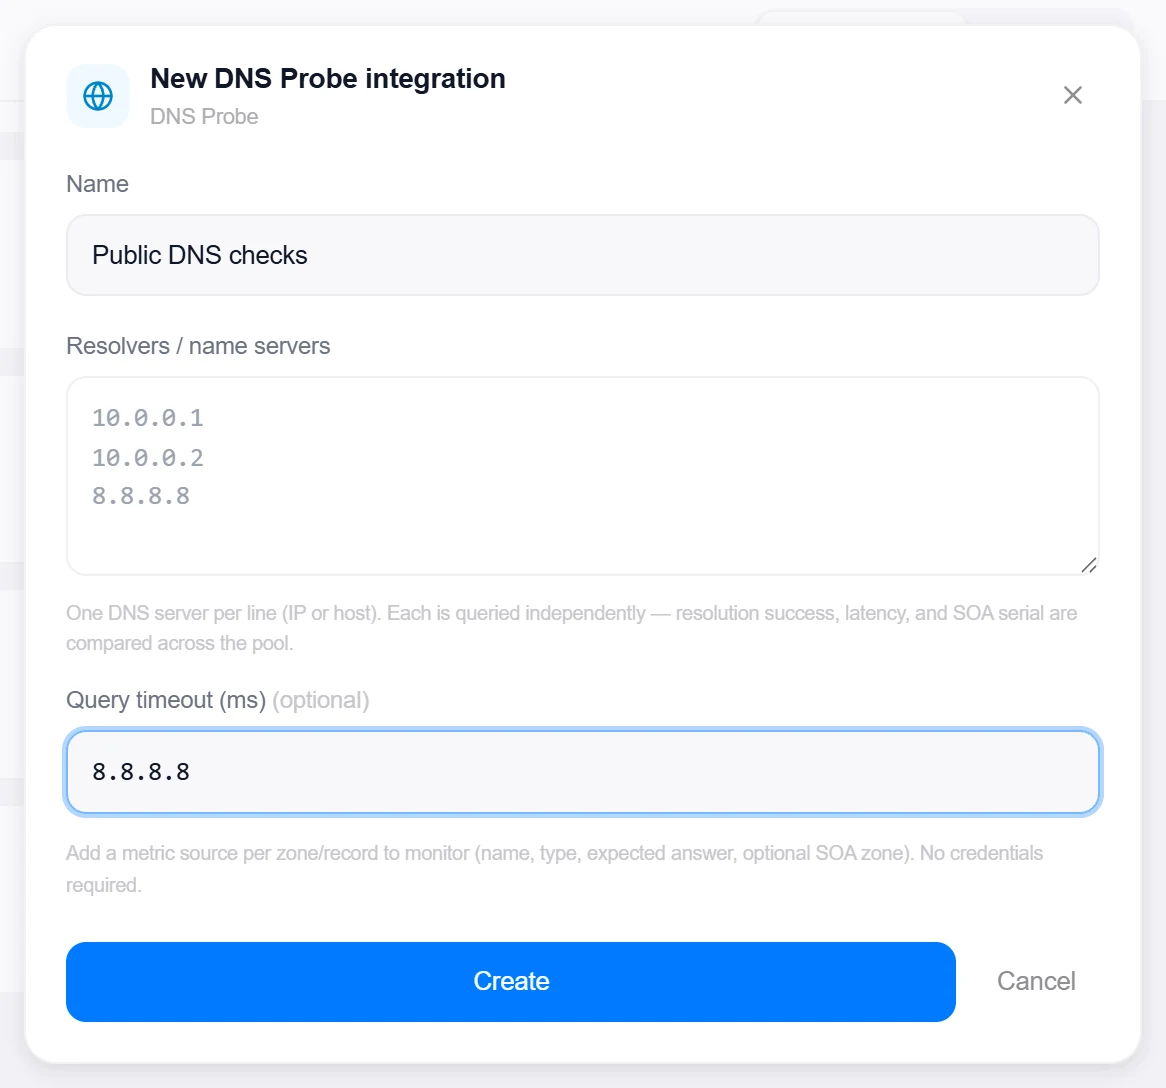
- List the resolversOne DNS server per line (IP or host) under Resolvers / name servers — this is the default pool every source probes. Optional Query timeout (ms) (default 3000) and Connect via proxy for LAN-only zones.
- Create, then verifyClick Create, then reopen the integration and click Test — it sends a root-SOA query to each resolver and reports how many answered. A resolver that refuses the root query still passes if its TCP/53 listener is up.

Target on a private network? Route it through a proxy agent. Proxy agents run inside your network — behind NAT, on a management VLAN, in an air-gapped segment — and reach targets the Topologix server can't. The agent polls the server every 15 seconds for its assignments, runs the checks locally, and pushes results back every 5 seconds, so no inbound firewall rules are ever needed. Set a default proxy on the integration; every metric source can override it. If a proxy goes offline, its sources are marked stale within ~90 seconds and the last known values stay visible.
2 · Add it to a flow
- Select the DNS nodeClick the node, open Metrics, then + Add and choose the DNS Probe integration.
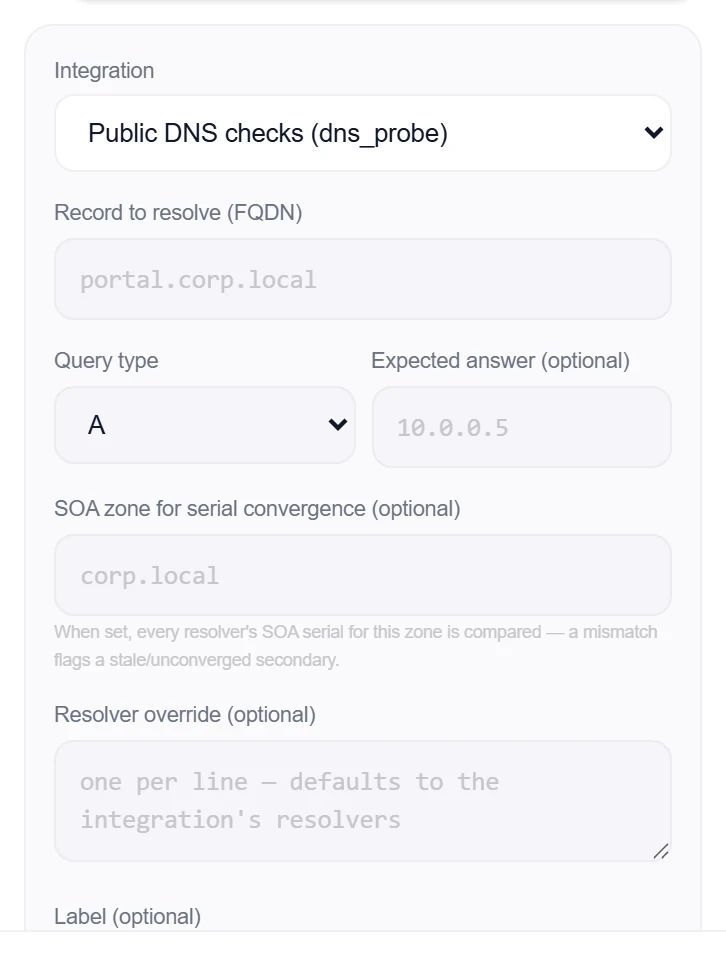
- Define the probeEnter the Record to resolve (FQDN) and a Query type (A, AAAA, CNAME, MX, TXT, NS, SOA, PTR, SRV). Optionally set an Expected answer the result must contain, an SOA zone for serial convergence, and a per-source Resolver override.
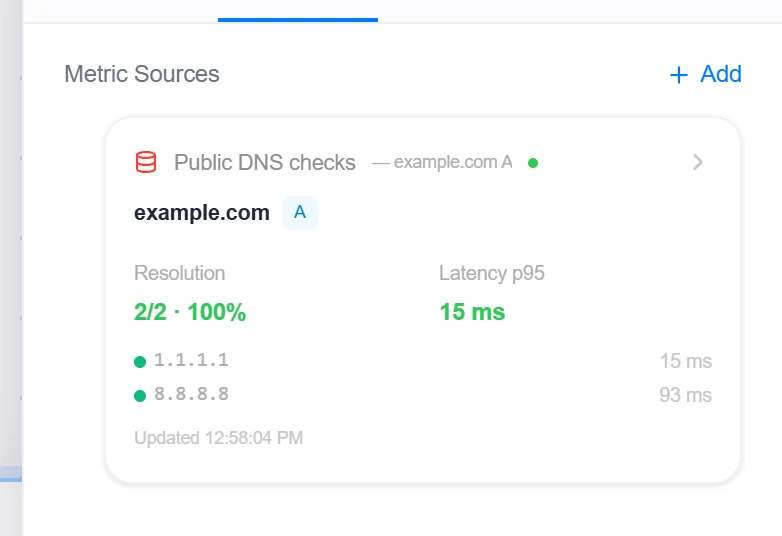
- SaveSet the interval and click Add Source. The card shows the success rate across the pool, p95 and max latency, expected-answer mismatches, SOA-serial convergence, and any resolvers with TCP/53 down.
Good to know
- Resolvers are probed independently and in parallel — one dead server lowers the success rate instead of failing the whole source, so the card tells you which resolver broke.
- The SOA-serial check compares every resolver’s serial for the zone: a mismatch flags a stale or unconverged secondary before clients start getting old answers.
- The expected-answer match is a case-insensitive substring over the returned records — enough to pin a VIP or CNAME target without brittle exact matching.
More Infrastructure & Networking integrations
See it on your own infrastructure
Book a demo and we will walk you through Topologix with your systems in mind: on our cloud, or self-hosted in your own network.