SNMP monitoring with Topologix
Infrastructure & Networking
Per-interface throughput and device health for routers, switches, and firewalls over SNMP v2c or v3 — 64-bit HC counters from IF-MIB (with automatic 32-bit fallback), auto-discovered interfaces, device-wide CPU/temperature/port-error checks, and vendor packs that turn a UPS, PDU, NAS, wireless controller, or firewall into a first-class canvas card.
Requirements
- SNMP enabled on the device: a v2c community string, or v3 credentials — noAuthNoPriv, authNoPriv, or authPriv, with MD5/SHA/SHA224/SHA256/SHA384/SHA512 auth and DES/AES/AES256 privacy. AES-256 comes in two incompatible key-expansion flavors — AES256 (Cisco/Reeder) and AES256B (Blumenthal); if authPriv times out with one, try the other.
- UDP reach to the device (default port 161). SNMP targets usually live on management VLANs the server can’t see, so this integration is marked Requires proxy — run a proxy agent inside that network. A directly reachable device (lab, same segment) works without one.
1 · Set up the integration
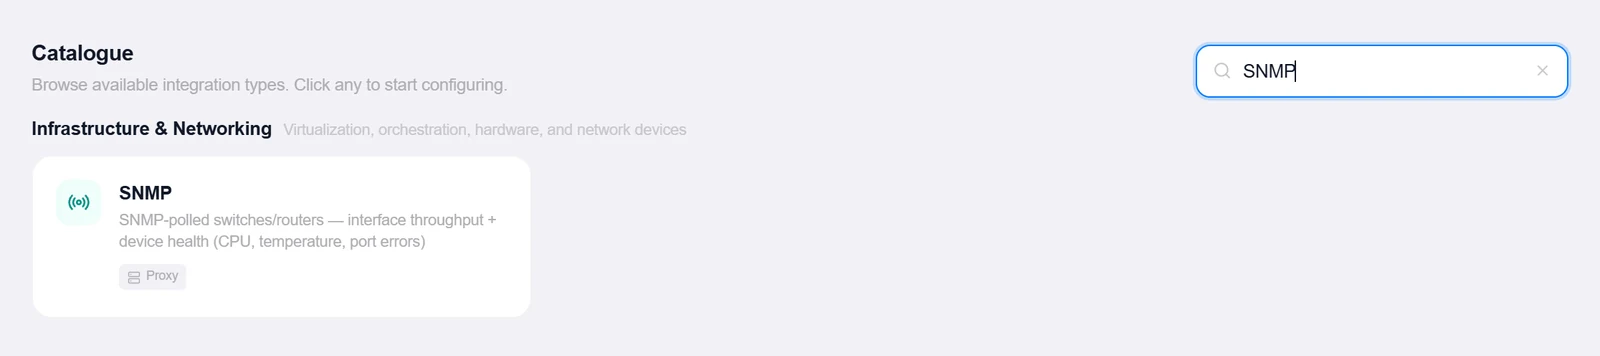
- Open the Integrations pageClick Integrations in the toolbar and pick SNMP from the catalogue.
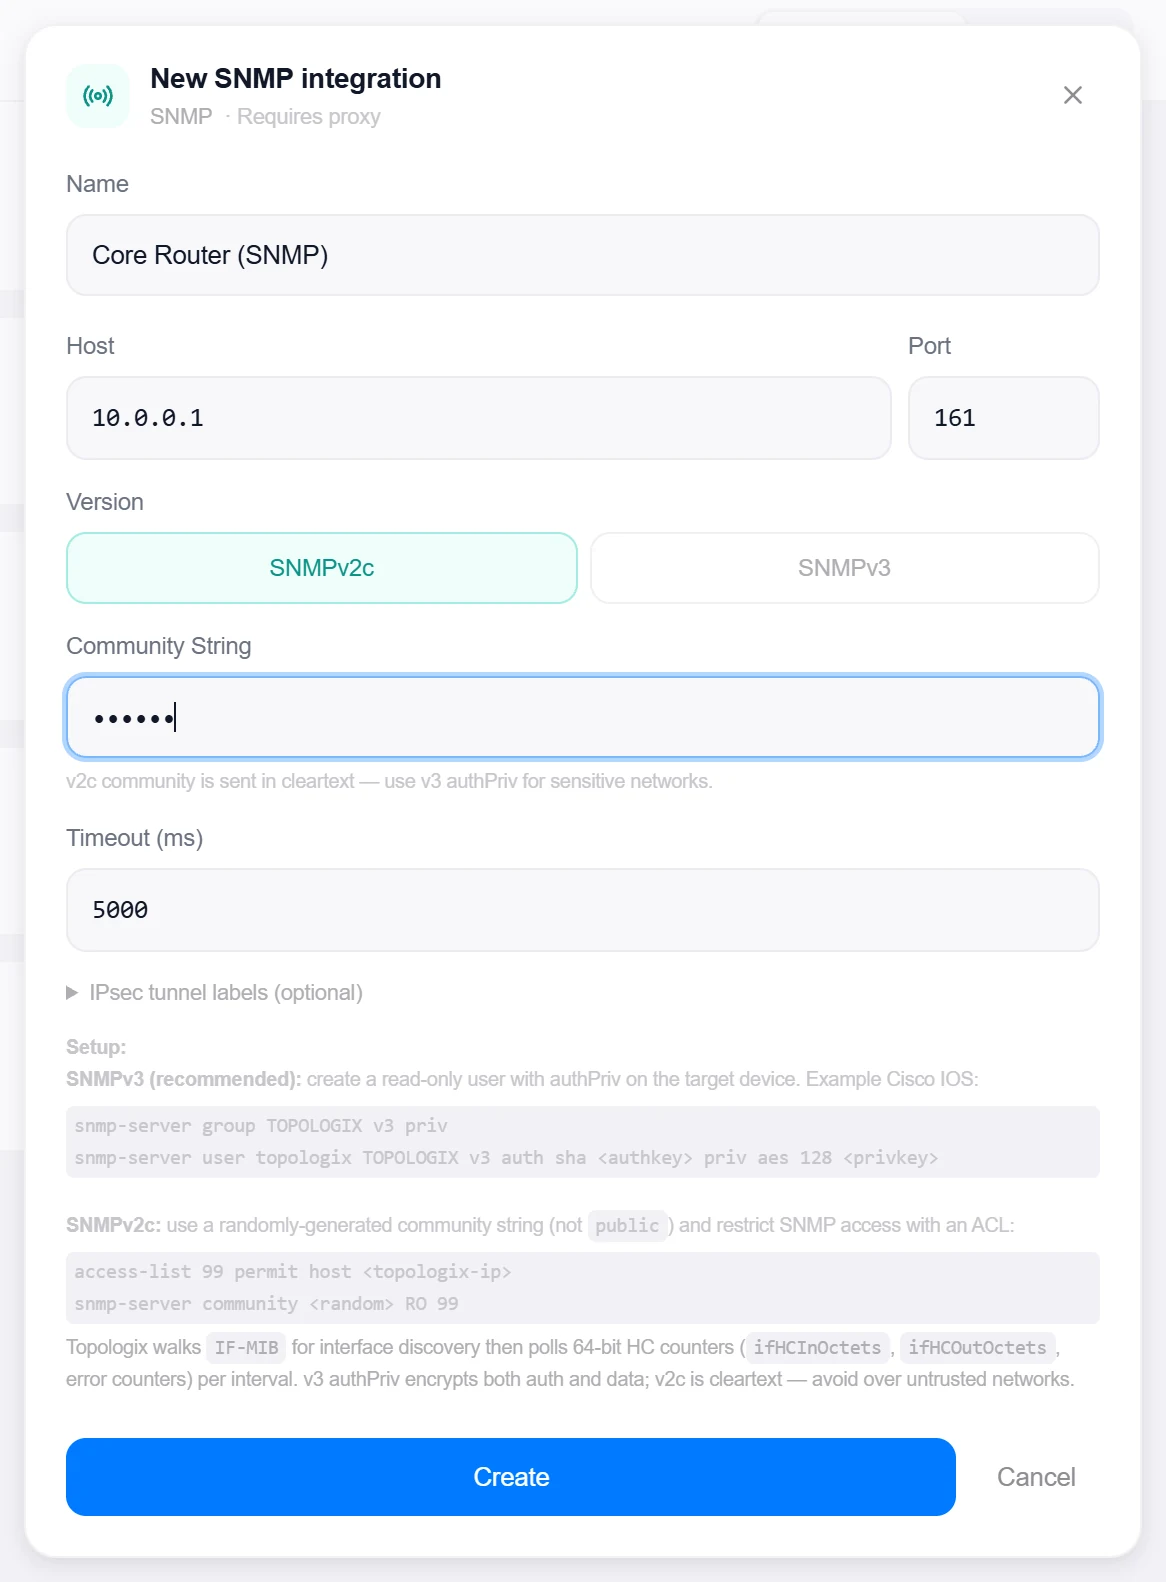
- Enter device address and credentialsHost, port, and either the v2c community or v3 username/auth/privacy keys. Timeout, Retries, and Bulk size (GETBULK rows per packet during table walks — lower it for old or embedded agents that truncate large responses) tune the transport for awkward devices.
- Create, then verifyClick Create — the drawer closes on success. Reopen the integration and click Test: it reads sysDescr to prove reachability and credentials.
2 · Add it to a flow
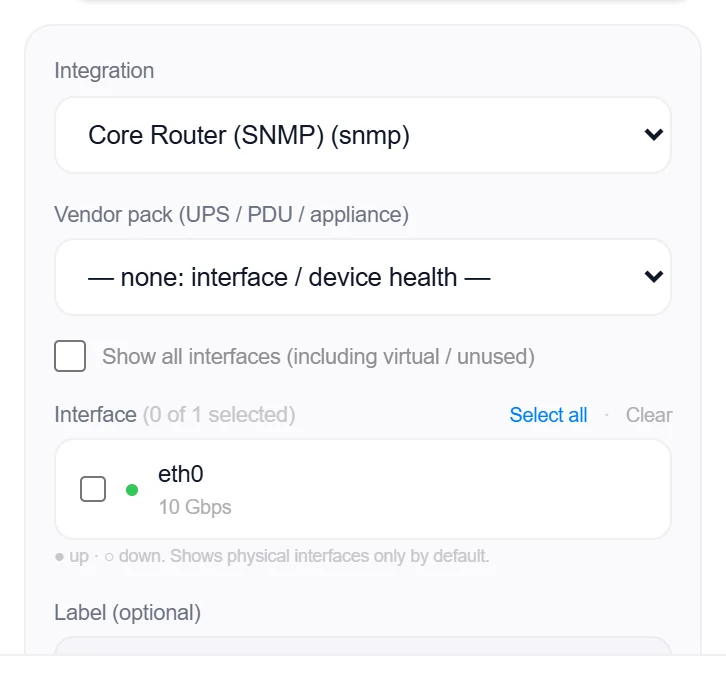
- Select the device nodeClick the node, open Metrics, then + Add and choose the SNMP integration.
- Pick one or more interfacesThe picker walks IF-MIB and lists physical interfaces (the Show all interfaces checkbox reveals virtual and unused ones). Select several and one source is created per interface — the button becomes Add N Sources. Leave every interface unselected to monitor device health only. Device health (CPU, temperature, port errors) rides along by default either way.
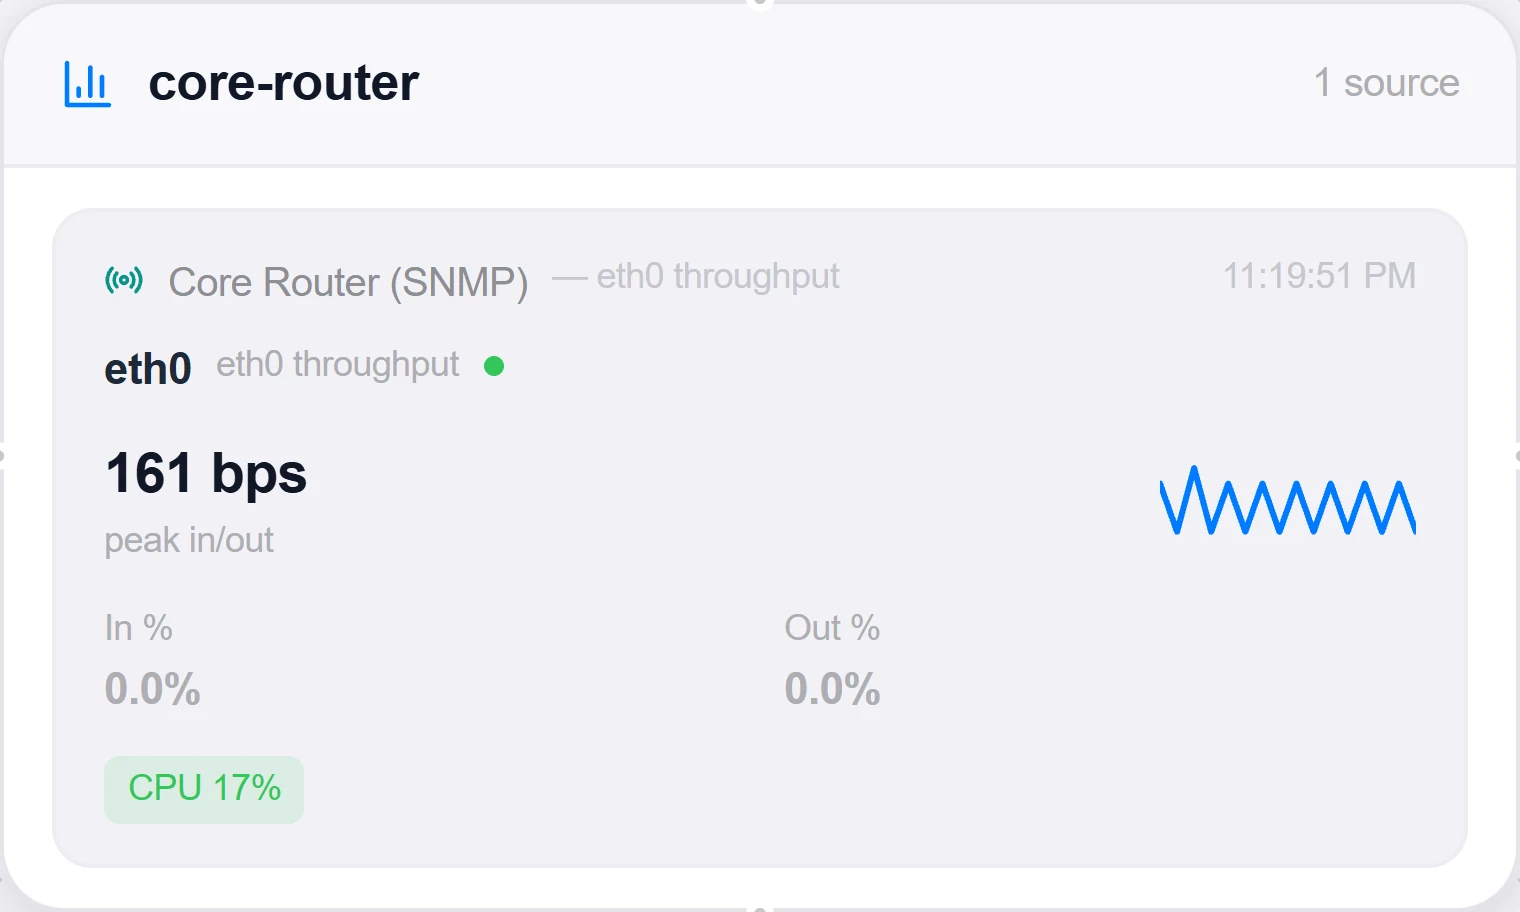
- SaveSet the interval and save. Each interface card shows In/Out bps with utilization %, error rates, link state, and the device-health block.
3 · Beyond interfaces: vendor packs & custom OIDs
Vendor pack (UPS / PDU / appliance)
Interfaces are the right lens for a switch — not for a UPS, a PDU, or a NAS. The Vendor pack dropdown at the top of the add-source form swaps the whole source into device mode: instead of the interface picker, the source polls a curated, vendor-specific OID set. The canvas card charts the pack's headline metric; the Metrics panel breaks out every value. 7 packs ship today:
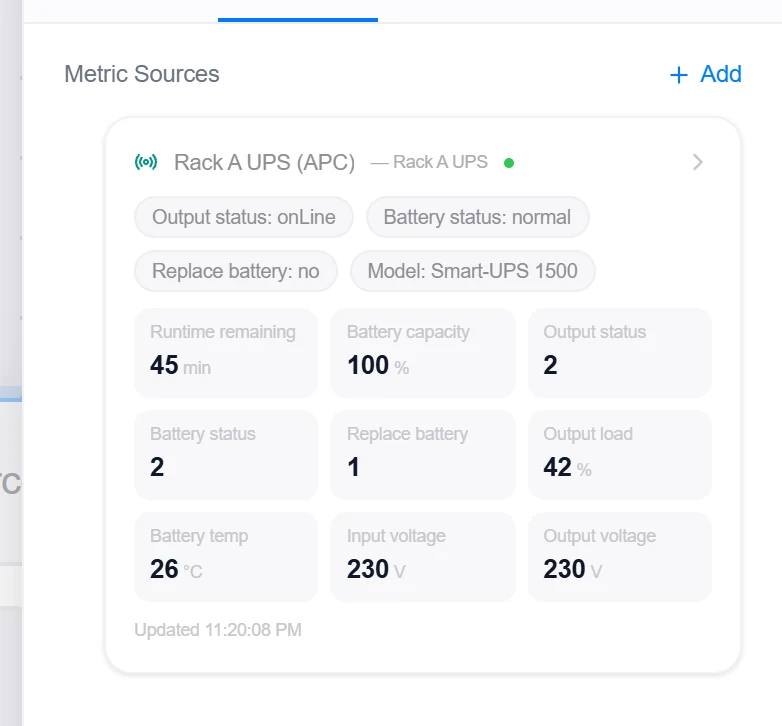
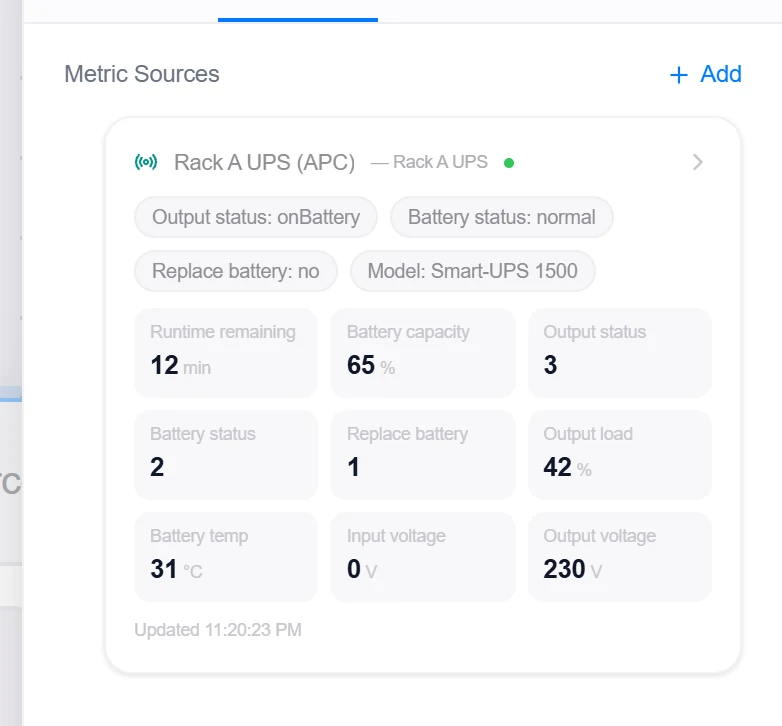
- APC UPS (PowerNet) — Runtime remaining (headline), battery %/status/temp, output status + load, input/output voltage, replace-battery flag.
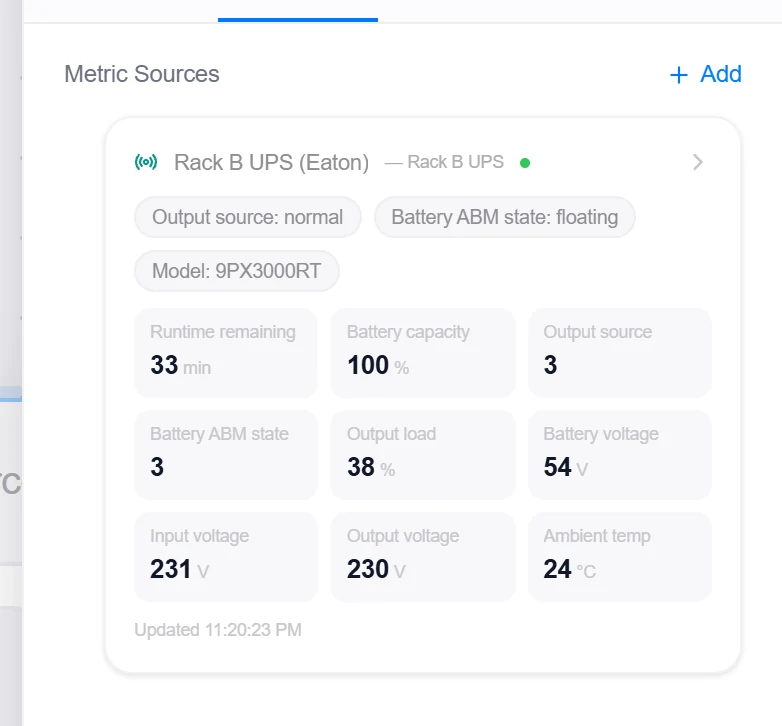
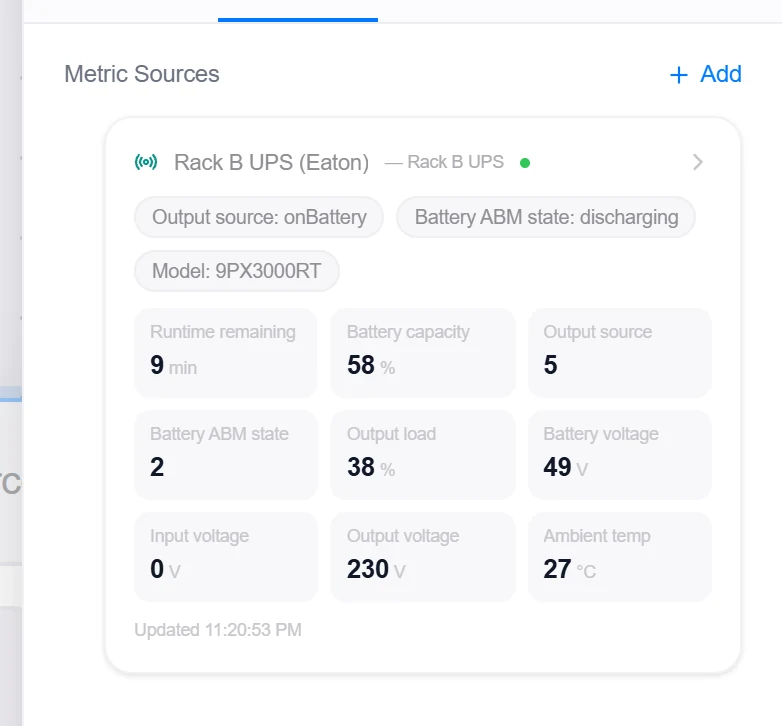
- Eaton UPS (XUPS) — Runtime remaining (headline), battery capacity/ABM state, output source + load, input/output voltage, ambient temp.
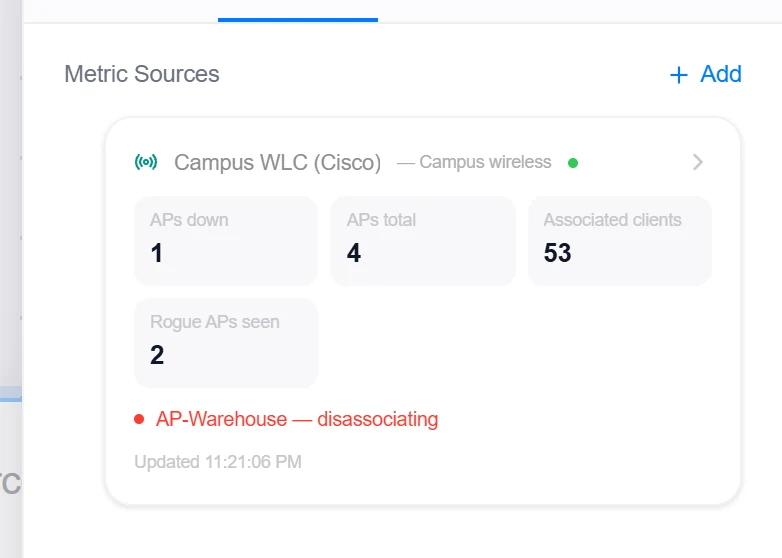
- Cisco WLC (AireOS/9800) — APs down (headline) + attention list, total APs, associated clients, rogue APs.
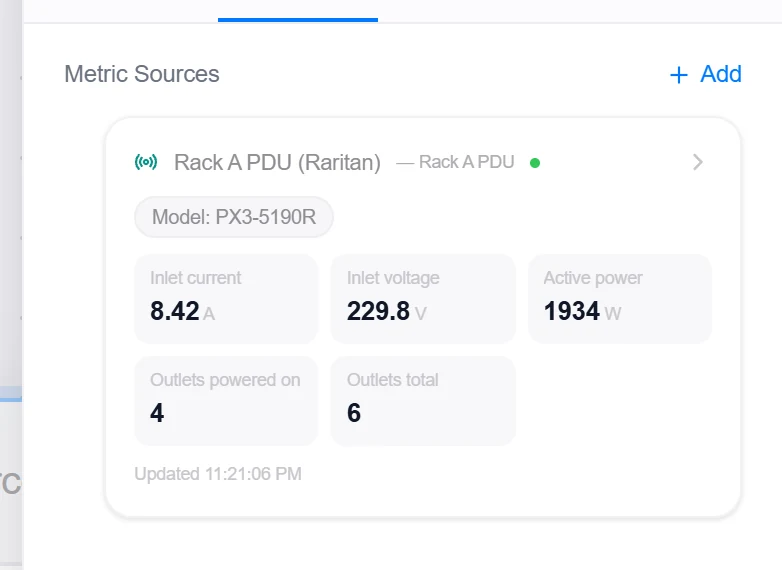
- Raritan / Vertiv PDU — Inlet RMS current (headline), voltage, active power, outlets powered on, per-outlet state.
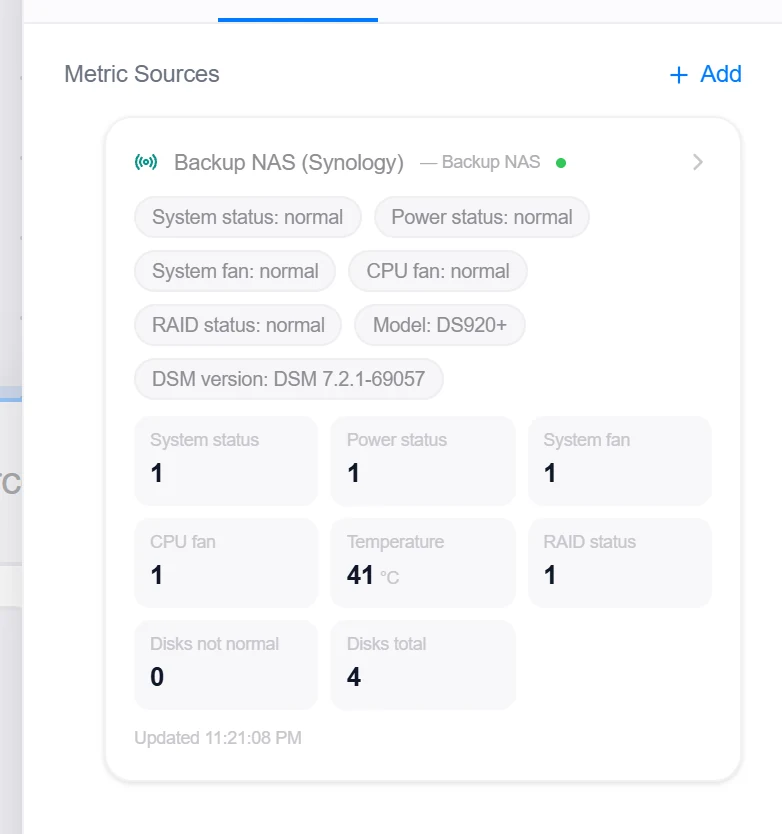
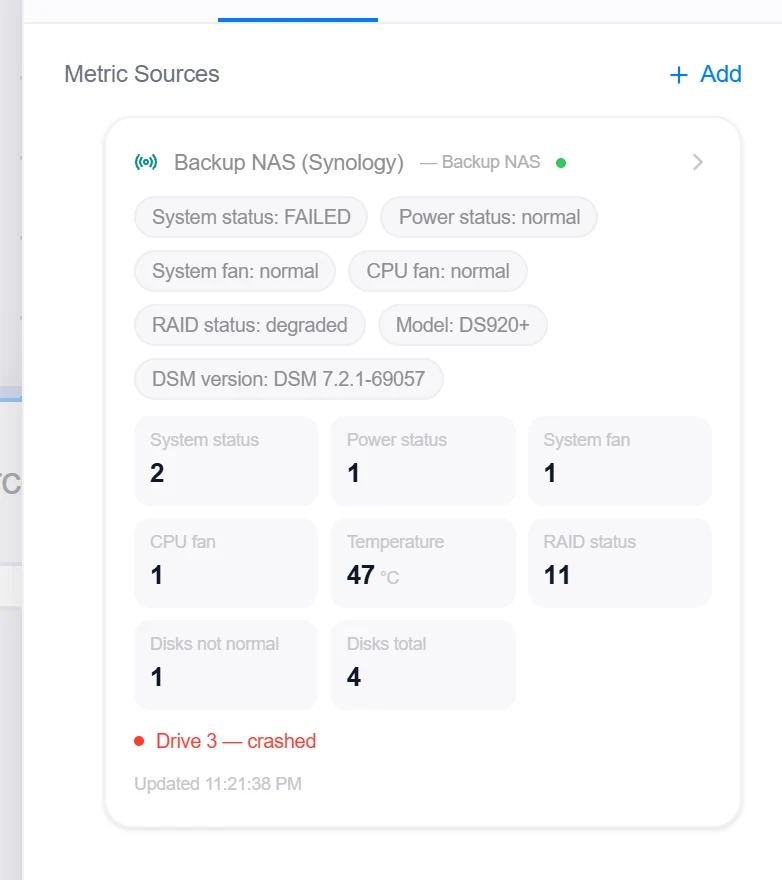
- Synology NAS (DSM) — System/power/fan status, temperature, RAID state, failed disks + attention list, DSM version.
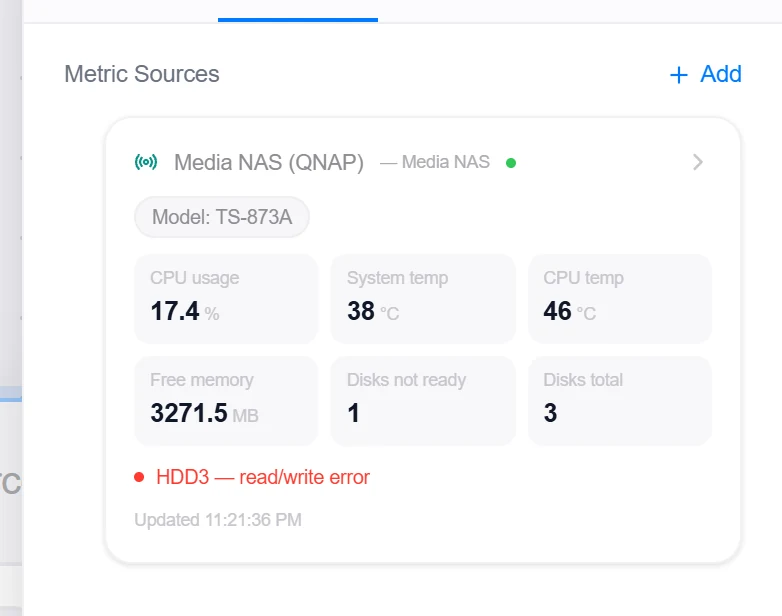
- QNAP NAS (QTS) — CPU %, system + CPU temperature, free memory, disks not ready + attention list, model.
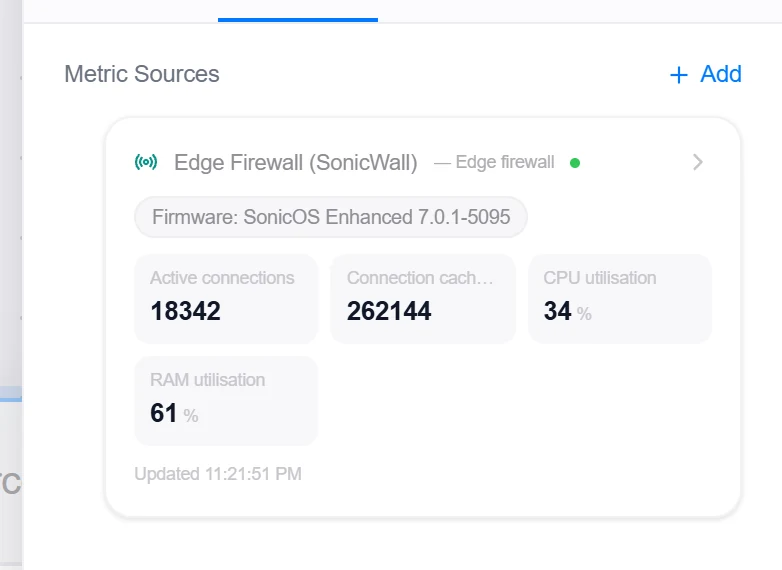
- SonicWall Firewall — Connection-cache entries (headline), max cache, CPU %, RAM %, firmware version.
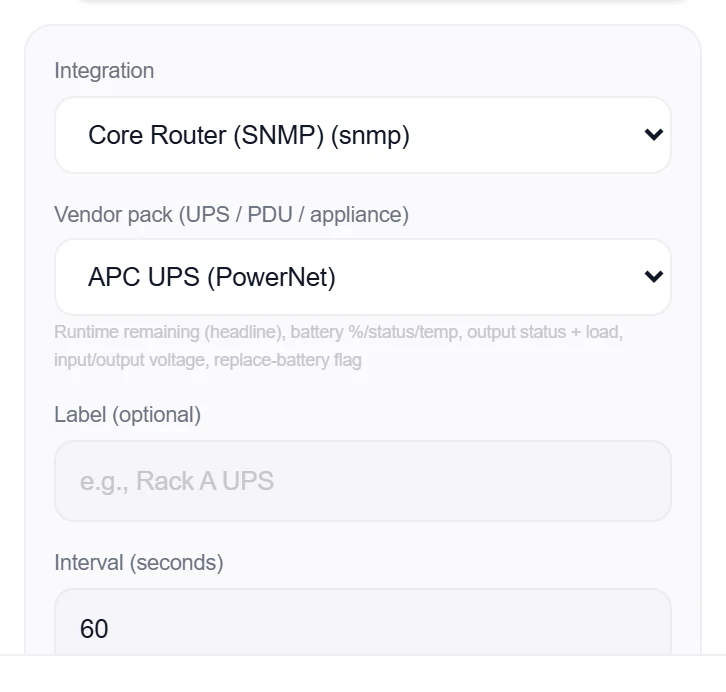
What the cards look like
One card per device, straight off the pack’s OID set — status enums rendered as readable chips, every metric as its own tile, and problem components called out by name. Every card below is the real product polling simulated devices that answer with the documented vendor MIBs.
When the device degrades
Status enums flip in place and problem components surface in the attention list — no thresholds to configure for state-based failures.
SNMP traps — hear about it between polls
Polling tells you the state every interval; a trap tells you the moment it changes. Add SNMP trap rules to any SNMP source (interface, vendor-pack, or custom-OID mode alike): each rule is a trap-OID prefix with a severity and a quiet window. Saving any rule automatically opens a v1/v2c trap listener on that source's proxy — default UDP 1162, because the proxy runs unprivileged; forward the standard port on the proxy host (Linux: iptables -t nat -A PREROUTING -p udp --dport 162 -j REDIRECT --to-ports 1162; Windows has no UDP portproxy — point devices at 1162 directly or use a firewall NAT rule). Point the device's trap target at the proxy, and a matched trap flips the source to warn/error between polls; the alarm clears on its own once no matching trap has arrived for the quiet window (visible at the next poll). Every trap from a matched device — rule match or not — lands in the trap timeline on the card, varbinds included. Traps are matched to sources by device address, scoped to the proxy that received them.
VPN tunnels — Cisco IPsec / IKE outages
On a Cisco IOS / IOS-XE router that terminates site-to-site IPsec, the device-health poll walks the tunnel tables of CISCO-IPSEC-FLOW-MONITOR-MIB — cipSecTunnelTable (phase 2) and cikeTunnelTable (IKE phase 1) — and the card lists one row per peer: up / down, the IKE state beside it, the flaps of the last 24 h and the last flip. Nothing to configure: a router whose IPsec MIB never answers (a switch, a router without crypto) produces no tunnel rows and no tunnel alerts.
How a down is seen. Cisco deletes a tunnel's row when it goes down, so there is no "down" value to read. Topologix compares each table walk with the previous one: a peer that was in the table and is missing in 2 consecutive reads (Tunnel down after, 1–10) is down, dated at the first read that missed it; it is up again when it returns. A read that failed or timed out never counts as "missing", the device snapshot shared by several sources is counted once per walk, and a server restart keeps the count (the state rides on the stored result). With the MIB live and the table empty, every known peer is missing — a full outage.
Flaps the poll never saw. A tunnel that dropped and came back between two polls still leaves traces: its active time restarted (cipSecTunActiveTime lower than before + the time between the reads), its table index was replaced by a young one, or its octet counters went backwards. That is recorded as a flap — a down and an up at the same instant — and raises VPN tunnel flapped (warning, clears after 15 min).
Alerts (source settings → VPN tunnel alerts): VPN tunnel down (error, one per peer), VPN tunnel flapped (warning), IKE (phase 1) down (warning — with a full outage it fires beside the tunnel-down alert of the same peer and both land in one alert group), VPN mass tunnel drop (error — 3 peers, or 50 % of at least 4, down within 15 min of each other). Peers can be excluded (IPs / CIDRs — dynamic DMVPN spoke-to-spoke or on-demand tunnels that go idle by design) or only named tunnels judged; a peer down for 72 h is forgotten (a tunnel removed from the config stops alerting). Names come from the card (pencil) or Get names over SSH.
History. Every down / up / flap is stored as a tunnel flip: the history charts carry them as markers, search_events finds them, and the monitoring bot answers "did the tunnel to 203.0.113.7 flap last night?" with get_metric_history { tunnel } (by peer address or name: the up series plus the down / up / flapped events of the window). Series: device.ipsec.activeTunnels, tunnelsDown, and per peer tunnels[?key=…].up / in / out bit/s.
DMVPN over SSH. DMVPN NHRP peers are not in these MIBs. An SSH / Network CLI integration can poll them on a schedule: add a metric source on it in the mode VPN tunnels (DMVPN / crypto sessions) for a device that is the integration's host or in its device list. Each poll logs in ONCE and runs show dmvpn and show crypto session brief (read-only; the Status column UA / UIA = an active SA, D = down); every DMVPN peer (per tunnel interface) and crypto session goes through the same comparison and the same alerts (a peer not UP — IKE / NHRP / DOWN — or gone in 2 consecutive reads is down; an uptime that restarted between two reads is a flap; the coarse "1d02h" form never fakes one). Default every 300 s, never faster than 60 s — an SSH login is far heavier on a router than an SNMP read (a faster schedule is answered from the last read; the server refuses a faster interval too). Proxy ≥ 1.278.0 for a proxy-polled device.
Hubs vs spokes. Each DMVPN tunnel interface's Type: decides what is judged. On a Hub every NHRP entry is a registered spoke: each one is tracked and alerts. On a Spoke only the static entries (Attrb with S — the NHS, its hub) are judged; a dynamic entry (D, DT1, DT2 …) is a spoke-to-spoke shortcut that NHRP builds on demand and lets expire — it is listed as shortcut, never alerts, and when it vanishes it is expired, not down. A hierarchical Hub,Spoke interface judges its NHS (static) and its own spokes (dynamic), and treats a dynamic entry with a shortcut mark (T1 / T2 / I2) as a shortcut.
One peer, one alert. A spoke appears in show dmvpn (by its NBMA address) and in show crypto session brief (its IKE peer — the same address): the crypto session is shown as the crypto detail of that DMVPN row and is not judged on its own, so one spoke outage is ONE "VPN tunnel down". The up / tracked counts and the mass-drop rule count distinct peers, not rows. Several crypto rows of one peer on one interface fold into one (any up → up).
Idle and standby. In the Status column UA, UIA and UK (UP-NO-IKE — the SA is up, IKE re-keys later) are up; D / DN down. UI (UP-IDLE — no traffic, an on-demand SA) is listed as idle and does NOT raise a tunnel-down by default — turn on Treat an idle crypto session (UI) as down on the source to judge it as not up; S (standby, a stateful-failover pair) is listed as standby and never alerts.
Incomplete reads. When a command does not reach the prompt — the per-command timeout, the pager limit or the output size cap — the output was cut: that table is marked incomplete, every peer it could not see is held (never counted as missing, never a mass drop), and the card says incomplete read with the warning. A busy router that answers slowly therefore never fakes an outage; raise the integration's command timeout if it keeps happening. The flap check also scales with the schedule: two reads up to max(10 min, 2.5 × the interval) apart are compared (one missed poll keeps the flap detection).
Client VPN users — AnyConnect / FlexVPN on the same router
A router that terminates remote-access users (AnyConnect, FlexVPN with EAP) on the same box as its site-to-site tunnels lists both in its IPsec tables — so every user who disconnects would read as a tunnel down. Topologix tells them apart and never raises a tunnel down, a flap or a "down since" for a user: the site-to-site block shows the tunnels only, and a line under it says Client VPN: N active now · M users in the past 24 h with a Users button (who, the public and the assigned address, connected since, ended or active, duration).
Where the names come from. When an SSH / Network CLI integration lists the router (its host or its device list) and the board may use it, a background read (Admin → System → Background workers → Client VPN sessions, every 300 s by default) logs in once and runs show crypto session brief and show crypto ikev2 sa detailed (read-only; the full detail, up to 4 MB / 60 s on a large headend). A session is a user when its Group/Phase1_id is the AnyConnect group ($AnyConnectClient$), it has a Username, or it sits on a Virtual-Access interface AND its IKEv2 SA carries a Remote EAP id. A Virtual-Access session alone — a FlexVPN, DVTI or EzVPN site-to-site spoke — stays a tunnel and alerts like any other. The username is the Remote EAP id; an account at privilege level 1 cannot read the IKEv2 detail, so sessions are listed without names (set an enable password on the integration). Proxy 1.282.0 or newer for a proxy-polled integration (1.282.1 for the large-headend limits).
Without SSH. Users are told apart from the SNMP IKE table only when it shows the exact AnyConnect identity (a user@domain identity needs the SSH read to confirm it); the line says names are hidden and how to get them. Usernames are personal data: they are kept 7 days (Client VPN sessions: retention), never in a stored result, an alert or a bot answer, and a viewer who reaches the device only through an organisation-shared integration without the right to see its address sees counts only.
Users from before, and a failed read. A user who disconnected before the router was read over SSH can still sit in the tunnel list as a red down since row — an absent peer is never turned into a user on a guess, because a real tunnel outage must never be hidden. An editor of the board clicks Not a tunnel — a user session on that row: the peer leaves the list and the up / tracked count on the next poll and is never tracked again (Marked as user sessions under the block lists them, with Undo). Once the SSH read works, a down peer whose address a stored user session came from leaves on its own, and — when the latest read listed the whole session table — Mark all down peers absent from the SSH session list as users lists those peers for one confirmation. When the SSH read fails the line says why (to whoever may see the device’s address); an authentication failure stops the reads to protect the account — fix the SSH integration’s credential and run its Test to resume.
Infrastructure → Network — every switch and router in one list
Every SNMP device your flows poll is listed on Infrastructure → Network (the tab once called Firewalls) next to the firewalls, the Zabbix network hosts and the switch / router nodes drawn on your canvases — one row per device, with its CPU, memory, ports up / total, uptime and last sample. The kind chips at the top (All · Firewalls · Switches · Routers · Other) filter the list; the link /?view=network&kind=router opens it on one kind.
- How the kind is decided — the first signal that answers: a kind an organisation admin set on the row; the node’s icon on the canvas (router / switch / firewall); the integration type (Aruba AOS-CX, UniFi, a SonicWall pack …); the SSH platform (ASA / FortiOS → firewall, NX-OS / EOS → switch, Junos / RouterOS → router); the device’s own
sysDescr/sysObjectID(ASR, ISR, MX, RouterOS → router; Nexus, Catalyst switch, Comware, EX → switch; ASA, FortiGate, PAN-OS → firewall), thensysServices(layer 2 only → switch, layer 3 → router); the Zabbix host’s description, templates and host groups; otherwise Other. The row says which one answered (“kind from: SNMP identity”). - Set the kind by hand — an organisation owner or admin picks Switch / Router / Firewall / Other in the row’s kind menu; Auto goes back to the automatic answer. The choice holds for the whole organisation and is recorded in the activity log.
- One device, one row — the same device seen by two sources, by Zabbix (same address or name) or drawn on another canvas is one row: “also in Zabbix”, “exports flows” (a NetFlow exporter with that address) and every canvas it is on. A UPS, PDU or NAS (a vendor pack or a Zabbix UPS / PDU / printer template) is not listed.
- Not monitored — a switch / router node on a canvas that nothing polls and Zabbix does not know is listed muted, with its management address and Open on canvas.
- Vulnerabilities — the chip after the kinds (behind a thin line) counts the devices with at least one known CVE; picking it lists every CVE of your identified switches, routers and firewalls in one view. By CVE: one row per CVE — severity and CVSS, known exploited (CISA KEV) with its date, EPSS, the hardware it needs (“only when running on …”), how many devices it affects (expand for the list), the fixed-in releases, the published date and its NVD page. By device: known exploited first, then critical, high and the total — the OS version (where it came from, how sure), the counts, the worst CVE and the release that clears its critical CVEs when NVD names each fix. Filter by minimum severity, known exploited only and platform; the search box matches CVE ids, summaries, device names and OS versions; a device opens its own Vulnerabilities tab. It is matched from the stored NVD / KEV / EPSS data (opening it sends nothing anywhere) and says how many devices are not identified yet or have no NVD product; at most 2 000 CVEs and 5 000 devices, and the summary says when a cap is hit.
/?view=network&kind=vulnsopens it. - Who sees what — the devices of the integrations you can see, the canvases you can open (a board you cannot open is never named) and the device address only when you own the integration or are an admin.
Link checks — both ends of every cable
The hourly neighbour scans (LLDP / CDP) also read the settings of every port that has a neighbour — its MTU, trunk or access mode, native or access VLAN and the VLANs a trunk carries — and what the neighbour advertises about its own end. Topologix then compares the two ends of each cable: MTU (e.g. 9216 on one side, 1500 on the other — warning; critical when giant frames are rising on either end), mode (trunk on one end, access on the other — critical), native / access VLAN (critical: untagged traffic leaks between VLANs) and the VLANs carried (stored for the bot; a warning on the Alerts page only when a VLAN on one end only is in use — its native VLAN or MAC addresses on it — and seen on two scans). A mismatch is raised once per cable, on the SNMP source of one end, and names both ends and ports.
- Both ends or advertised — when both switches are polled by Topologix their measured values are compared; otherwise this end is compared with what the other end advertises over CDP / LLDP (“isp-router advertises VLAN 200”).
- Unknown is never a mismatch — a value one end does not report skips that check, a down or stale link is not judged, and a check that becomes unknown keeps its alert as it is; a mismatch clears after two scans that found it fine. MTUs closer than 32 bytes are the same (vendors count the Ethernet header differently); a Nexus 5000 / 6000 / FEX does not report its port MTU and says so.
- Where — Network → Details → Neighbours shows MTU, mode, native VLAN and the VLAN difference of both ends per link with a red / amber badge; the SNMP card has a “Link mismatch: …” line (the “MTU differs from this switch’s other … ports” line is the older same-switch check). The bot reads them with network_links and search_events.
- Ignore a link — a flow editor can ignore a deliberate difference (a 1500 uplink to an ISP) with Ignore this link; the alert resolves at the next poll and Undo ignore brings it back. The choice is recorded in the activity log.
- Needs proxy 1.283.0 or newer for a proxy-polled switch; switch it off under Admin → System → Background workers (Network link checks: on / off). Not covered: the L3 ip mtu / OSPF MTU, per-VLAN spanning tree and duplex.
BGP sessions — down, flapping, prefixes dropped, and a looking glass
On a router whose BGP4-MIB answers, the device-health poll reads every BGP neighbour — state, admin status, remote AS (the 4-byte AS from the Cisco / Juniper table when BGP4-MIB shows AS_TRANS 23456), the local address and its interface, the established time and transitions, the last error (decoded: “Hold timer expired”, “Cease: administrative shutdown” …) and, on Cisco and Juniper, the prefixes received / accepted. IPv4 unicast of the default VRF only — BGP4-MIB has no VRF or IPv6 view. A router without BGP4-MIB can be read over SSH instead: add a metric source on an SSH / Network CLI integration in the mode BGP sessions (show ip bgp summary, Junos show bgp summary, FortiOS get router info bgp summary; every 300 s by default, never faster than 60 s; proxy 1.294.0 or newer — an older proxy is refused when you save).
How it is judged. Each read is compared with the previous one: a session that was Established and is out of Established for 2 consecutive reads is down (error, one per peer), dated at the first read that saw it out; back in Established is up. A session that reset between two reads — the transitions counter rose, or the up time went backwards — or that was out for fewer reads than the grace is a flap; 3 flaps in 24 h make it flapping (warning). The received prefixes of a session up for at least 5 minutes that fall by 50 % of their maximum of the last 24 h, or to 0, are a prefix drop (warning; a lasting new level stops alerting once the old maximum leaves the window). An admin-down (shut) neighbour and one never seen Established are listed but never alert; a neighbour gone from the table for 3 reads is forgotten; a failed or cut read never counts. Every knob is on the source form with its effective value and where it comes from (this source / default): the three alerts on / off, the grace (1–10 reads), the flap count (1–100), the drop (10–100 %), the window (1–168 h) and peers never alerted (IPs / CIDRs).
- Network → BGP — every session of the devices you can see: device, peer, AS, state, up / down for, prefixes received / accepted / advertised, flaps in 24 h, the interconnect (the LLDP / CDP neighbour on the session’s local port) and the last error; searched, filtered (down, flapping, prefix drop) and sorted on the server, 50 a page. A row opens its timeline (down, up, flapped, prefixes dropped) and its received-prefix chart over 24 h / 7 days. The device dialog has the same as a BGP tab. Without the right to see the poller’s address you see the AS, never the addresses.
- Looking glass — one read-only query on the device over its SSH integration: BGP summary, BGP neighbour detail, BGP route (an IPv4 prefix), ping (5 echoes, 1 s each) and traceroute (IOS / IOS-XE, ≤ 15 hops). Ping and traceroute run only as fixed command templates; anything else is refused before it reaches the device. The organisation owner and its admins may use it, and the members listed in Settings → Organisation → Network; one query every 10 s per user, one every 30 s per device; secrets are removed from the output (“Secrets removed: n”) and each query is in the activity log.
- RIPEstat (opt-in) — in Settings → Organisation → Network an owner or admin can list the organisation’s own prefixes (up to 20) and AS numbers (up to 5) and turn RIPEstat on: Network → BGP then shows, for each, how many RIPE RIS peers see it, the origin AS (an origin that is not yours is called out) and the RPKI state of each prefix for your first AS number. Only those prefixes and AS numbers are sent to stat.ripe.net — no device, address or organisation name — and the answers are cached 15 minutes. Off by default.
- History and the bot — down / up / flap / prefix-drop events are kept like the tunnel flips (history markers,
search_events— the lb source has the history, the finding source the sessions that are down, flapping or dropping prefixes right now); seriesbgpPeers[?key=…].up/.prefixesReceived,bgpPeersUp,bgpPeersDown. The assistant never runs the looking glass.
Configuration backups — encrypted on the proxy
An SSH integration with Config snapshots on reads each device’s running configuration once a day, a few minutes after a “configuration changed” syslog line, or on Read now. Choose how it is kept: Proxy backups (encrypted, stay on the proxy host) — the default for a new opt-in when the integration has a proxy — keeps the full configuration encrypted (AES-256-GCM) in data/config-backups/ of the proxy’s install folder and never sends it to Topologix; Server snapshots (redacted) stores the redacted text on the server as before. With proxy backups only the changed lines leave the proxy, by section (“interface Gi1/0/17: mtu 9216 → 1500”), and every secret — pre-shared keys, passwords, enable secrets, SNMP communities, key strings, certificates — is shown only as changed (value hidden), never its old or new value, in the UI and to the AI alike.
- A warning on the device — each change raises “Configuration changed on <device> — …” on the Alerts page, on the device’s SNMP source (else its SSH VPN tunnels source); one warning per device, refreshed by further changes, cleared after a window (24 h by default) or by Acknowledge in the device’s Config tab. A device no source polls keeps the warning in its Config tab only. A proxy whose disk is full raises “backups stopped”.
- Where — Network → Details → Config lists each backup (time, size, hash, changed / unchanged) and the masked changes; the SSH integration’s Config snapshots block has the same per device, plus the retention (newest 50, none older than 365 days by default), the auto-delete of decrypted files and the warning’s window.
- Decrypt on proxy — the integration’s owner or an administrator (never a board editor) can have the proxy write one backup in clear to
data/config-backups/decrypted/on the proxy host; Topologix shows the exact path and when it is deleted (after 1 h by default, at most 20 files at once, Delete now removes it sooner). The content never travels to Topologix; each request is in the activity log and limited to 6 per user in 10 minutes. - The key — created on the proxy at the first backup (
data/config-backups/backup.key, readable by the proxy’s service account only; on Windows SYSTEM and Administrators). Losing it loses the backups: keep an offline copy withnode dist/index.js backups key export --out <file>in the proxy folder. A VM or host backup of the proxy carries the key and the encrypted files together. To replace a proxy:node dist/index.js backups key import <file>on the new one and copy the old one’sdata/config-backupsfolder; until then a backup made by the old proxy says where it is stored. Updates keepdata/. - Switching to proxy backups offers “Delete the server-stored texts of this integration” (the hashes and the change history stay); the first backup after a switch, or on a new proxy, is a new baseline. Needs proxy 1.284.0 or newer.
Custom OIDs (advanced)
When no pack fits — a vendor we don’t ship, or an exotic corner of a device — pick Custom OIDs (advanced)… in the pack dropdown and define your own rows. Each row is one OID: a Number (an instance OID, with optional unit, scale factor, an enum map like 2=onLine, 3=onBattery that renders integer states as readable chips, and a counter → rate/s mode for ever-growing counters), a Text value, or a Table aggregate (count/sum/min/max/avg over a column walk, with equals/not-equals row filters and an optional attention list joined from a name column). A table aggregate can also show every row as a table — tick that and, alongside the aggregate number, the card renders one labelled row per table entry (named from the name column, e.g. per-PSU temperature or per-disk status), with a per-row alarm that fires if any row breaches (addressable as rows.<key>[].value). Every numeric row can carry its own alarm (>, <, or = with warn/error severity), and every value is also addressable in the generic threshold editor as values.<key>. The Test read button polls the draft rows immediately and flags any OID the device did not answer — a typo’d OID otherwise fails silently, one poll interval at a time. Rendering rides the same card as vendor packs; the history dialog charts each value over time.
By name (MIB import): upload the vendor’s MIB files and the OID field autocompletes by name — type ifOperStatus and the row fills in the OID, label, unit, and enum map (a table object becomes a Table aggregate automatically). The same dictionary names vendor OIDs and varbinds in the SNMP trap timeline. There are two libraries: a platform-global one a super-admin manages under Admin → MIB files (shared by every organization), and a per-organization one an org owner/admin manages under Organization → MIB Library (private to that org, for vendor MIBs specific to their devices). Each member resolves against the global library plus their own org’s; if a name collides, the org’s copy wins for that org. Upload a module together with the modules it IMPORTS (standard SMI/IF-MIB modules are built in, and platform modules count as available dependencies for org uploads).
Scan device… (needs proxy ≥ 1.98.0) walks the live device against the MIB modules you pick and lists the objects it actually answers, with their current values — tick the ones you want and they become custom-OID rows, kinds and enums prefilled. It is the fastest way to build a custom source for a device whose MIB you have but whose OIDs you don’t want to look up by hand.
Good to know
- Interface rates prefer 64-bit HC counters and fall back to 32-bit legacy counters per direction — Cisco loopbacks, SVIs, and tunnels that lack HC rows still chart correctly.
- The first poll after adding a source primes the counters, so rates appear from the second poll onward (custom-OID rows in counter → rate/s mode behave the same way).
- Pack mode and interface mode are mutually exclusive per source — add one source per pack device, and as many interface sources as you like on the same integration.
- LAGs, virtual interfaces, and rate-limited links often report a wrong or zero ifHighSpeed, which silently zeroes utilization %. The Advanced: speed overrides section under the interface picker pins the real speed per interface — both the % math and the card use it.
- Custom-OID sources on a proxy need proxy ≥ 1.96.0 — an older proxy reports “Unknown SNMP pack: custom” on the card until updated (Admin → Versions pushes the update). Trap listening needs proxy ≥ 1.97.0.
- The switch / router classification reads
sysDescr,sysObjectIDandsysServiceswith the device health (proxy ≥ 1.279.0 on a proxy-polled device); with an older proxy the device is still listed on Infrastructure → Network, classified by its canvas icon or Zabbix templates, and its ports-up column stays empty. - VPN tunnel tracking needs proxy ≥ 1.276.0 on a proxy-polled router: older proxies read the wrong active-time column (every tunnel showed ≈ 1 s) — their reads are still compared for downs, but never for active-time flaps.
- SNMPv3 traps are not received yet (the listener is v1/v2c); a trap whose source address doesn’t match any SNMP source on that proxy is dropped and counted, and a source configured by hostname won’t match a trap arriving from its bare IP — configure trap-sending devices by IP.
More Infrastructure & Networking integrations
See it on your own infrastructure
Book a demo and we will walk you through Topologix with your systems in mind: on our cloud, or self-hosted in your own network.