HPE iLO monitoring with Topologix
Infrastructure & Networking
Server hardware health straight from the iLO’s Redfish API — temperatures with the device’s own thresholds, power draw, PSU/fan/drive/NIC state — aggregated on the canvas card the way the iLO UI itself summarizes the chassis.
Requirements
- An iLO account (read-only is enough) on iLO 4, 5, or 6.
- HTTPS reach to the iLO management address from the server or a proxy agent on the management network. Self-signed certificates are accepted with the verification toggle.
1 · Set up the integration
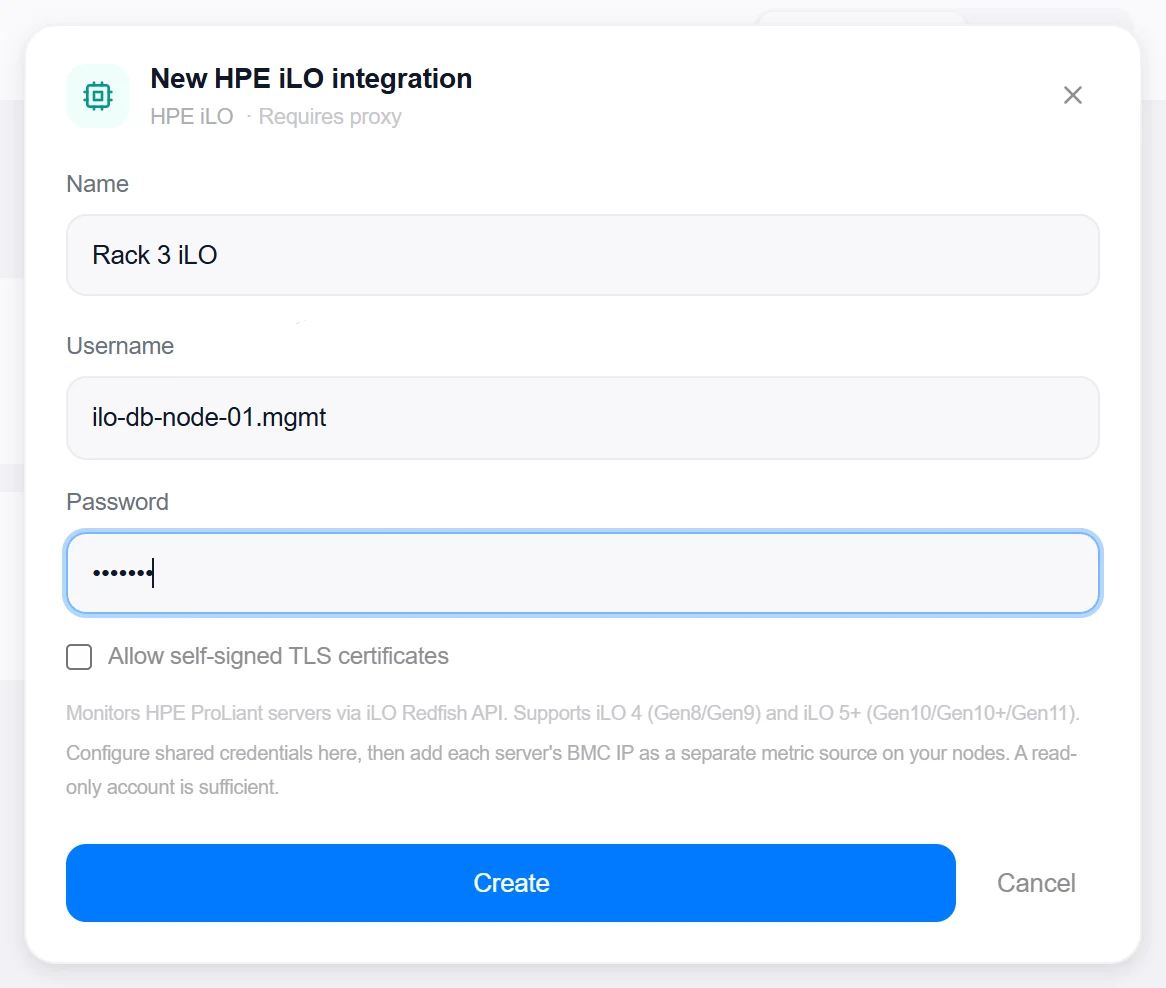
- Open the Integrations pageClick Integrations in the toolbar and pick HPE iLO from the catalogue.
- Enter the iLO address and credentialsThe management hostname or IP plus the monitoring account. Credentials are encrypted at rest.
- Create, then verifyClick Create, then reopen the integration and click Test — it reads the Redfish system root and reports model and serial, and reads the chassis too so the HPE product number (for example
P19725-B21) is captured alongside them. That second value is the one HPE’s warranty form insists on.

Target on a private network? Route it through a proxy agent. Proxy agents run inside your network — behind NAT, on a management VLAN, in an air-gapped segment — and reach targets the Topologix server can't. The agent polls the server every 15 seconds for its assignments, runs the checks locally, and pushes results back every 5 seconds, so no inbound firewall rules are ever needed. Set a default proxy on the integration; every metric source can override it. If a proxy goes offline, its sources are marked stale within ~90 seconds and the last known values stay visible.
2 · Add it to a flow
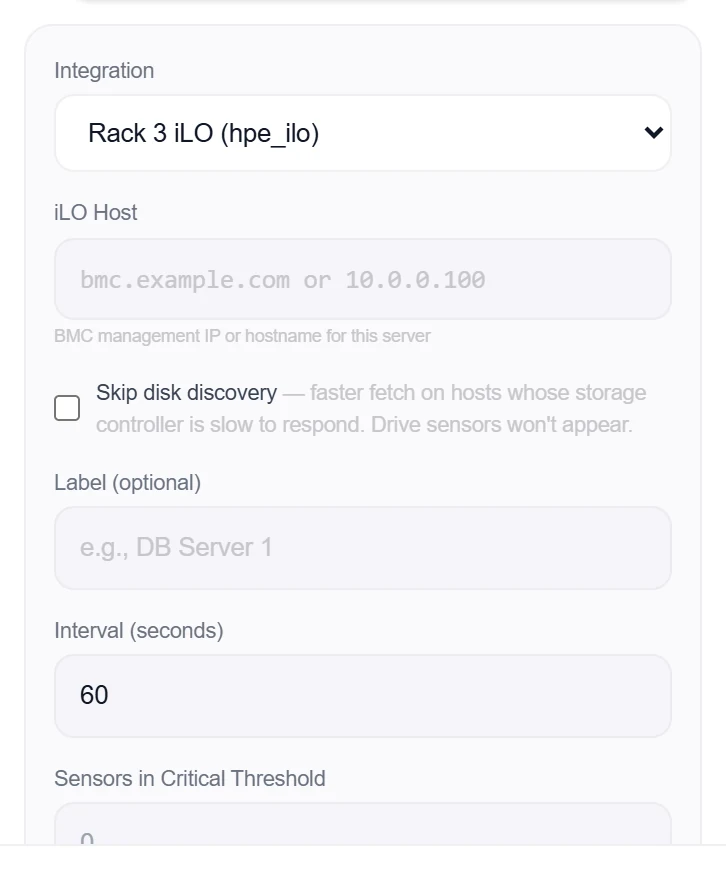
- Select the server nodeClick the node, open Metrics, then + Add and choose the iLO integration.
- Pick sensors (or take everything)Discovery lists every temperature, PSU, storage controller, and NIC by the same names the iLO UI shows. Leave the selection empty to track everything; optionally pick one temperature to display as a pill on the card.
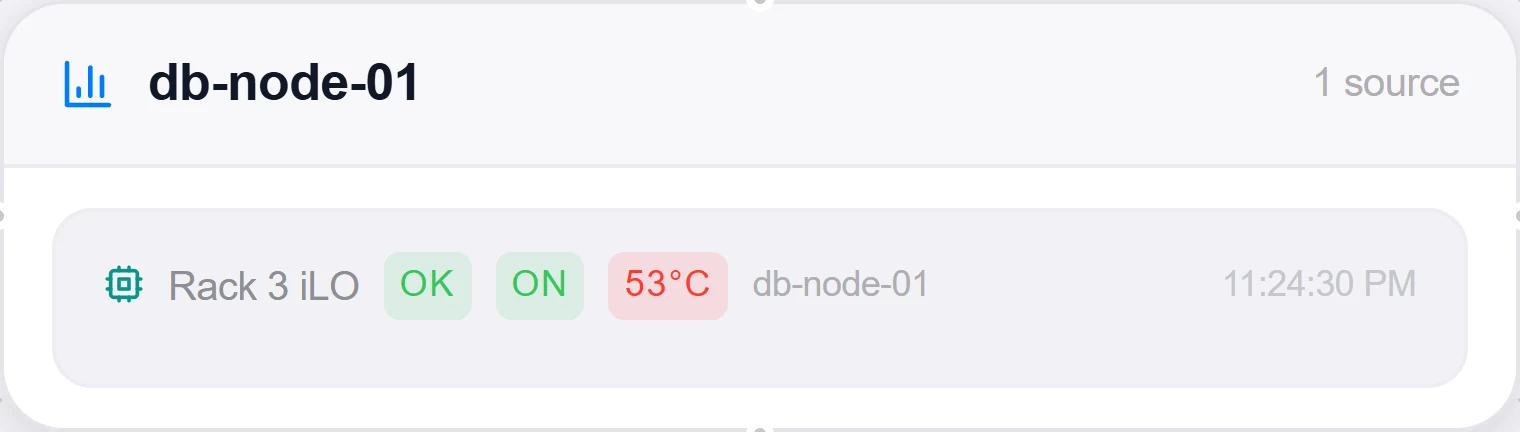
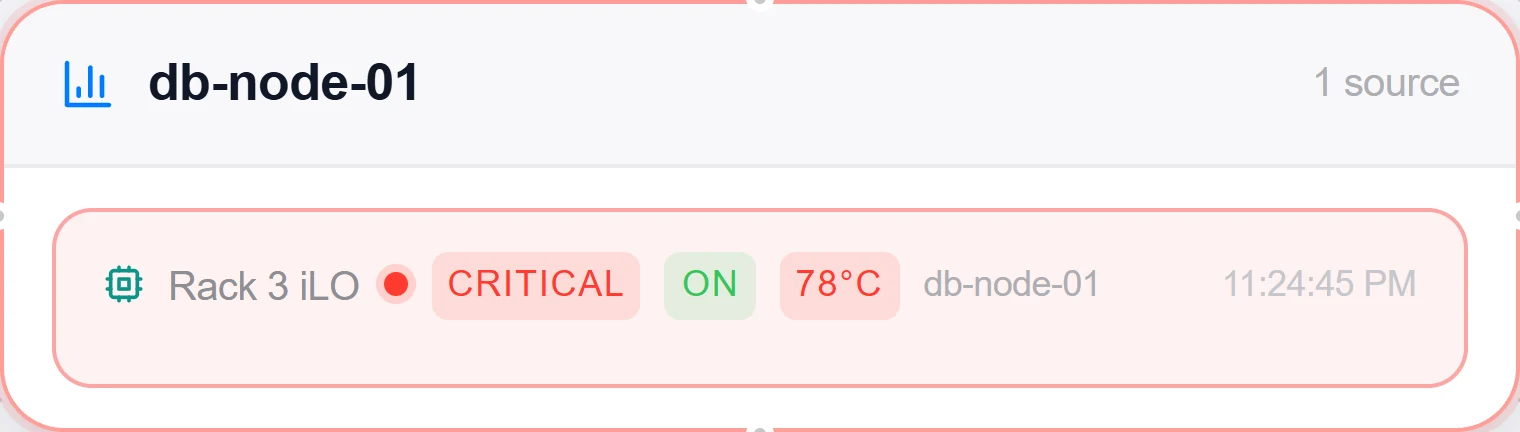
- SaveClick Add Source. The card shows power state, health, total watts, and aggregate counts ("16/16 temps · 8/8 fans · 2/2 PSUs"); any sensor going Critical turns the card red.
Good to know
- A "skip drives" toggle exists for hosts whose storage controller is the slow Redfish path.
- Warranty. HPE publishes no warranty API — the official check is a captcha-protected web form — so an iLO server’s warranty row is entered by hand or imported from CSV, via Set warranty on the card. Topologix does the tedious half: it captures both values that form demands, the serial number and the product number (the chassis
SKU, for exampleP19725-B21), and shows at a glance which servers still have nothing on file. - Export for HPE in the warranty dialog hands you the list in groups of 20 — the most HPE’s form takes in one submission — each with its own copy button. Paste a group into HPE’s form, then paste the answer straight back into the same dialog as CSV. The importer always dry-runs first: it tells you how many rows matched servers Topologix knows, how many didn’t, and which rows it couldn’t read, before anything is written. Rows that match no server yet are still imported and flagged — a warranty sheet usually arrives before the monitoring does.
- A hand-entered or imported record is never overwritten by any background refresh. A server whose warranty is unknown — or whose BMC reports a placeholder serial like
To Be Filled By O.E.M., which cannot be matched to anything — stays grey on the card and says so. It is never coloured green.
More Infrastructure & Networking integrations
See it on your own infrastructure
Book a demo and we will walk you through Topologix with your systems in mind: on our cloud, or self-hosted in your own network.