AWS WAF monitoring with Topologix
Security
WebACL traffic verdicts from CloudWatch — allowed, blocked, counted, CAPTCHA, challenge, and passed request counts per WebACL, with a blocked-rate percentage and a CAPTCHA solve rate. Covers both Regional WebACLs (ALB / API Gateway / AppSync) and CloudFront-scoped ones — the "why" behind a 4xx spike that CloudFront logs alone can’t tell you.
Requirements
- An IAM user with the read-only policies
AWSWAFReadOnlyAccess+CloudWatchReadOnlyAccess— the minimum is wafv2:ListWebACLs and cloudwatch:GetMetricData. Only read calls are ever made. - The access key pasted into the drawer; AWS is reached from the Topologix server directly — no proxy agent involved.
1 · Set up the integration
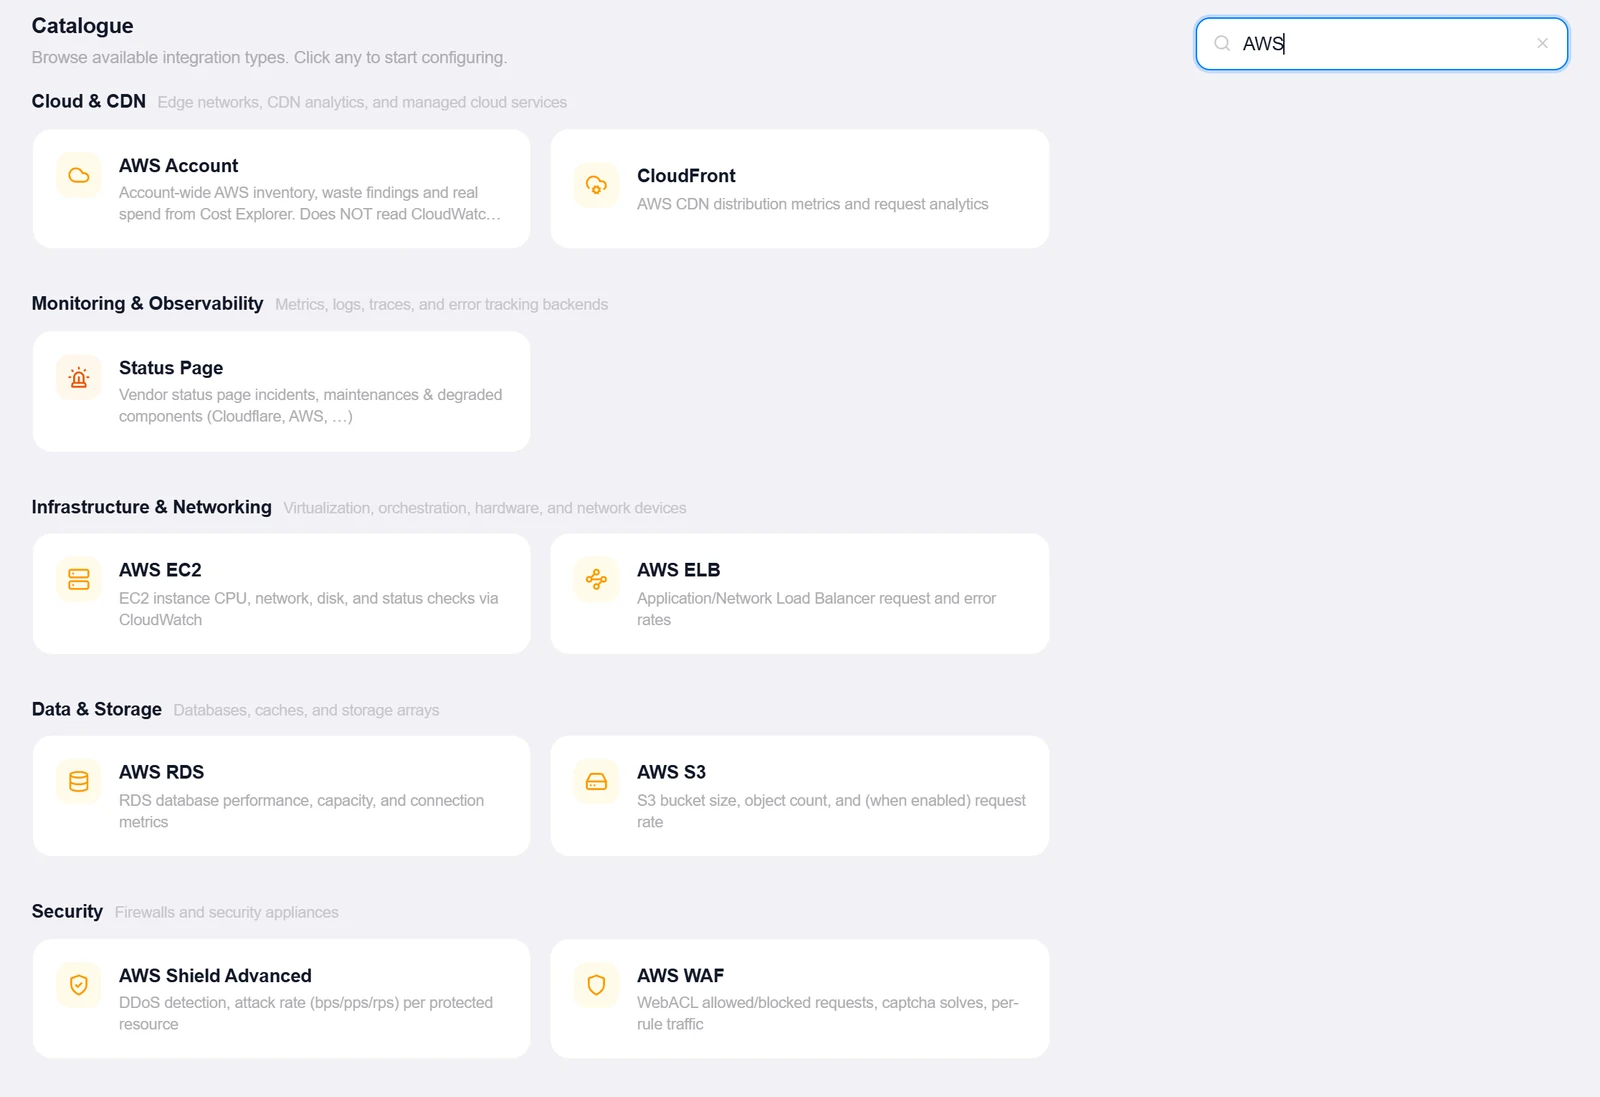
- Open the Integrations pageClick Integrations in the toolbar and pick AWS WAF from the catalogue.
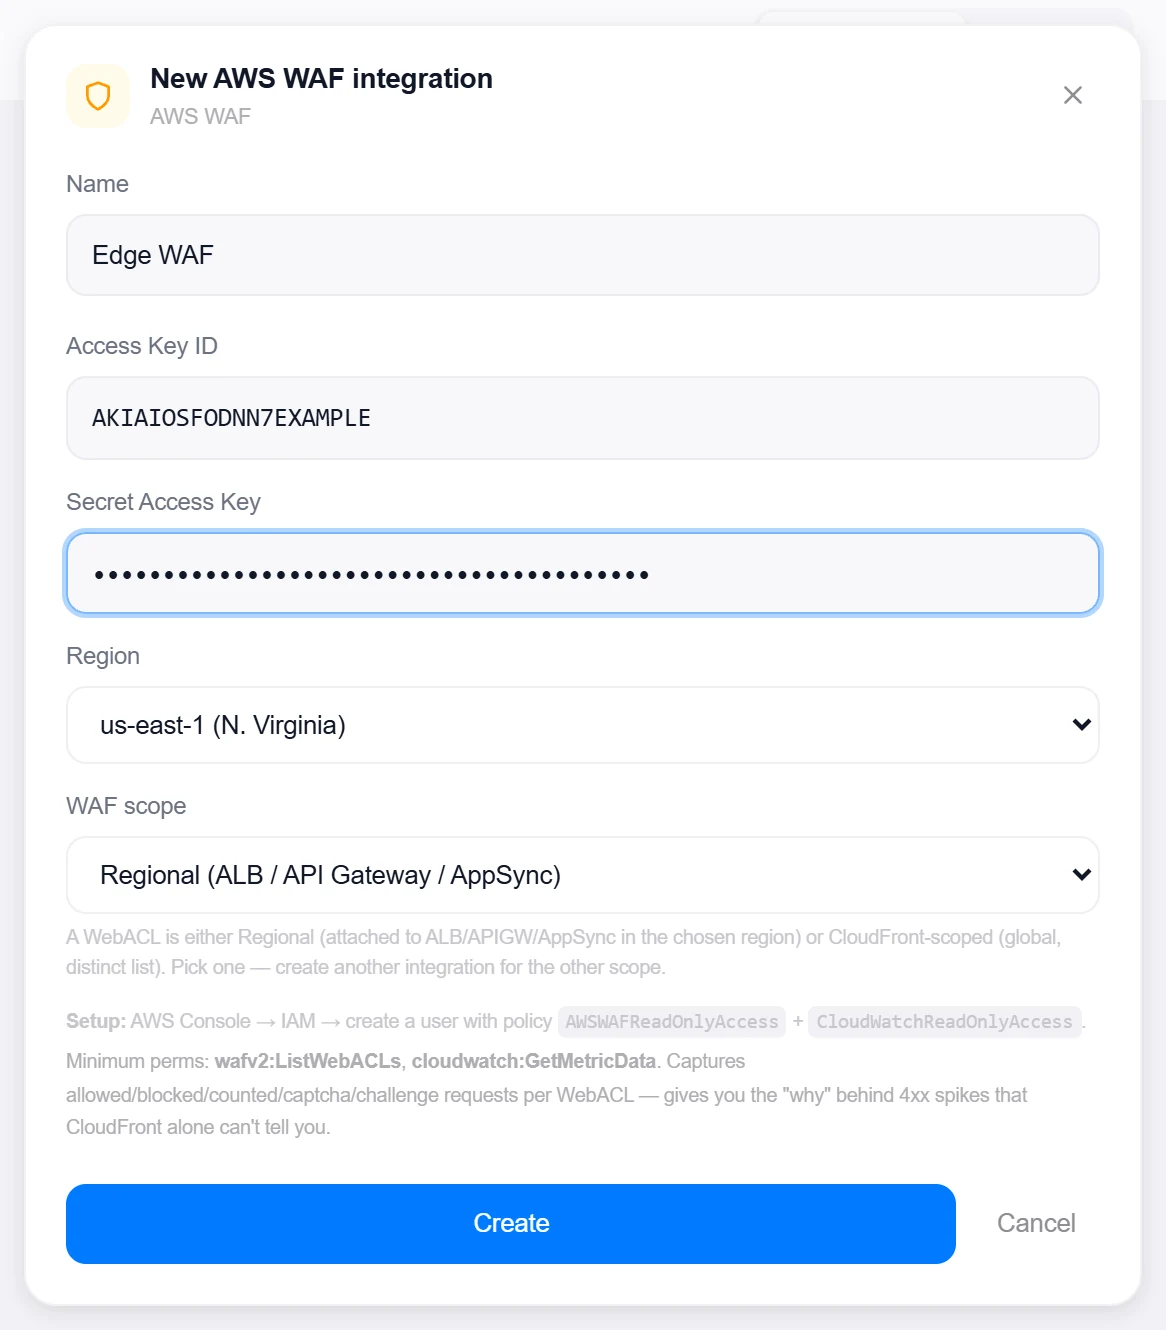
- Enter the AWS credentialsAccess Key ID, Secret Access Key, and the Region from the drop-down.
- Pick the WAF scopeRegional (ALB / API Gateway / AppSync) or CloudFront (global, queried from us-east-1). A WebACL is one or the other — create a second integration for the other scope.
- Create, then verifyClick Create, then reopen the integration and click Test — it lists the scope’s WebACLs and reports "Connected — N WebACL(s)", with plain messages for bad keys or missing IAM permissions.
Target on a private network? Route it through a proxy agent. Proxy agents run inside your network — behind NAT, on a management VLAN, in an air-gapped segment — and reach targets the Topologix server can't. The agent polls the server every 15 seconds for its assignments, runs the checks locally, and pushes results back every 5 seconds, so no inbound firewall rules are ever needed. Set a default proxy on the integration; every metric source can override it. If a proxy goes offline, its sources are marked stale within ~90 seconds and the last known values stay visible.
2 · Add it to a flow
- Select the protected nodeClick the node behind the WebACL, open Metrics, then + Add and choose the WAF integration.
- Pick WebACLsDiscovery lists the scope’s WebACLs (name, scope, description) as checkboxes — every ticked ACL becomes its own metric source. Set the CloudWatch Period (1 min / 5 min / 1 hour / 24 hours).
- SaveSet the interval and click Add Source. The card shows allowed / blocked / counted / CAPTCHA / challenge / passed counts for the window, the total, the blocked rate %, and the CAPTCHA solve rate.
Live canvas screenshots for this integration require a real AWS WAF environment, so this guide shows the configuration screens only — the flow steps above work exactly like every other integration.
Good to know
- CloudFront-scoped WebACLs live in us-east-1 no matter which region the integration is set to — both the WAF API and the CloudWatch metrics are queried there, with the Region dimension set to "Global".
- Metrics are read with the
Rule=ALLdimension, so the figures are WebACL-wide totals — per-rule breakdowns are not fetched. - The CAPTCHA solve rate (valid tokens ÷ CAPTCHA challenges) is only computed when CAPTCHA challenges actually occurred in the window; otherwise it shows no value rather than a misleading 0.
More Security integrations
See it on your own infrastructure
Book a demo and we will walk you through Topologix with your systems in mind: on our cloud, or self-hosted in your own network.