Palo Alto monitoring with Topologix
Security
PAN-OS firewalls and Panorama over the XML API. A firewall card mirrors the PA dashboard: data-plane and management-plane CPU, memory, session load against the model’s session-table maximum, connection rate, throughput and packets/sec, environmentals, HA pair state with config sync, interface health with per-poll drop/error deltas — plus GlobalProtect active users per gateway when remote access is configured. A Panorama card counts managed firewalls connected vs disconnected.
Requirements
- A dedicated administrator (Device → Administrators) with the Superuser (read-only) role — or a custom admin role granting XML API → Configuration: Read and XML API → Operational Requests: Read.
- HTTPS reach to the management interface from a proxy agent picked under Run on (management networks rarely reach the server directly); self-signed certificates are accepted with the toggle.
- Per-rule drops (rule-hit-count, drop counters): the same role also needs XML API → Log: Read, used for the on-demand denied-connection sample when a rule is drilled into.
1 · Set up the integration
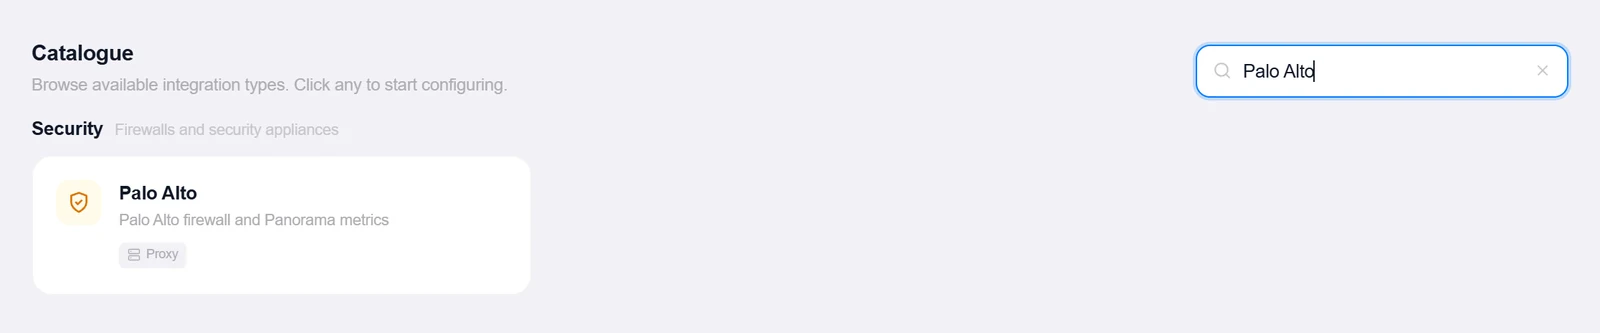
- Open the Integrations pageClick Integrations in the toolbar and pick Palo Alto from the catalogue.
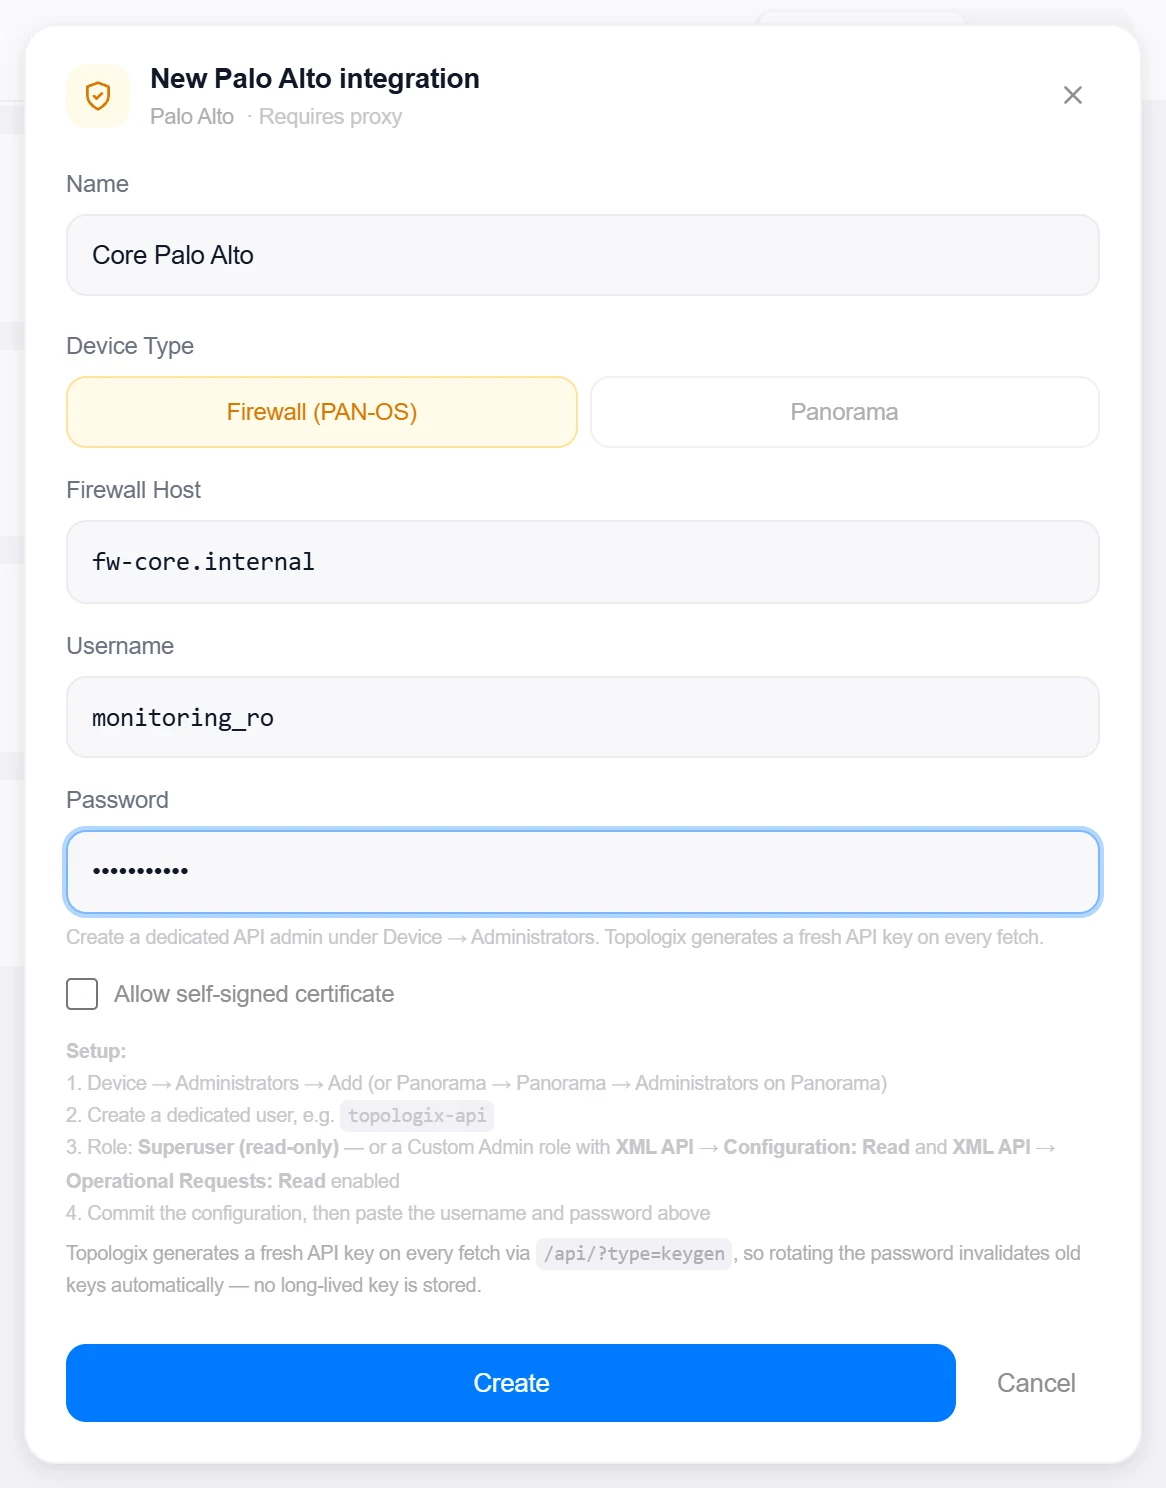
- Pick the device typeTwo tiles: Firewall (PAN-OS) or Panorama.
- Enter host and credentialsFirewall/Panorama Host, Username, Password. There is no API-key field on purpose: Topologix generates a fresh key on every fetch via
/api/?type=keygen, so rotating the password invalidates old keys automatically and no long-lived key is stored. - Create, then verifyClick Create, then reopen the integration and click Test — it reports "Connected — Firewall/Panorama hostname (model) PAN-OS version".
Target on a private network? Route it through a proxy agent. Proxy agents run inside your network — behind NAT, on a management VLAN, in an air-gapped segment — and reach targets the Topologix server can't. The agent polls the server every 15 seconds for its assignments, runs the checks locally, and pushes results back every 5 seconds, so no inbound firewall rules are ever needed. Set a default proxy on the integration; every metric source can override it. If a proxy goes offline, its sources are marked stale within ~90 seconds and the last known values stay visible.
2 · Add it to a flow
- Select the firewall nodeClick the node, open Metrics, then + Add and choose the Palo Alto integration.
- Add the sourceNo per-type options — one source describes the whole appliance.
- SaveSet the interval and click Add Source. Firewall: DP/MP CPU, memory, sessions active vs max, connection rate, pps and throughput, environmental alarms, HA state with sync, interfaces up/total with drop/error deltas, and GlobalProtect users per gateway. Panorama: total / connected / disconnected devices plus its own HA health.
Live canvas screenshots for this integration require a real Palo Alto environment, so this guide shows the configuration screens only — the flow steps above work exactly like every other integration.
Good to know
- CPU is reported the way the PA UI reports it: data-plane CPU from the resource monitor and management-plane CPU from the sys.monitor 1-minute average — the inflated
topsnapshot fromshow system resourcesis deliberately not used, and a plane that can’t be read shows nothing rather than a bogus number. - VM-series answers "Environmentals not supported on this platform", so temperature/fan/PSU rows are absent on VMs — normal, not a fault.
- Interface drops/errors/bps are deltas between polls; the first sample establishes the baseline and shows zeros.
- GlobalProtect — who is connected. The card’s GlobalProtect row counts active users per gateway and splits them by tunnel type (SSL / IPSec); the chevron on that row opens the sessions dialog, which asks the firewall live for
show global-protect-gateway current-user: user and domain, computer name, client OS and GlobalProtect app version, tunnel type, public IP with source region, tunnel (virtual) IP, login time and the remaining session lifetime, grouped or filtered by gateway, user, device or IP. The Recent tab addsprevious-user— who logged out, when and why (client logout, session expired, inactivity).statisticsand the gateway configuration ride along for exact totals and the “n / max users” capacity hint. Read-only: nothing here can disconnect anyone, the list is never stored (counts only go into history and alerts as GlobalProtect users), rows are capped at 500 with the total shown, and usernames or hostnames matched by your organization’s redaction rules appear as chips. Needs the XML API Operational Requests permission and a proxy agent ≥ 1.130.0 (older proxies fall back to a direct server call when the firewall is reachable from it).
More Security integrations
See it on your own infrastructure
Book a demo and we will walk you through Topologix with your systems in mind: on our cloud, or self-hosted in your own network.