Check Point monitoring with Topologix
Security
Check Point over its two native APIs, picked by device type: the Management API (/web_api/) on a Security Management Server or MDS for fleet state — gateways connected via SIC, access policy installed — and the Gaia API (/gaia_api/) on a gateway itself for box vitals: CPU, memory, cluster state, interface health with per-poll deltas, hardware sensors where exposed, and the concurrent-connection count.
Requirements
- Management Server: an administrator with the "Read Only All" permission profile — Topologix logs in with read-only sessions, so nothing can be changed even in principle. The Management API must be running (
api status/api startover SSH). - Gateway: a read-only Gaia user (User Management → Users, with a role that allows the Gaia REST API) on port 443. Everything on the vitals card comes from read-only Gaia calls. Only two figures need a script run on the box — the concurrent-connection count and the drop reasons / DoS counters — and there is a way to get the drop figures without giving this account any script permission: see Firewall drops & permissions below.
- HTTPS reach to the management server or gateway from a proxy agent picked under Run on; self-signed certificates are accepted with the toggle.
- Per-rule drop hits need a linked Management server (the Management server picker on a Gateway integration) with a read-only admin — password or API key — and that admin must not be locked, or the rulebase-hits call fails. The same link can carry the drop reasons and DoS counters when the admin's permission profile has Run One Time Script (Gateways → Scripts).
1 · Set up the integration
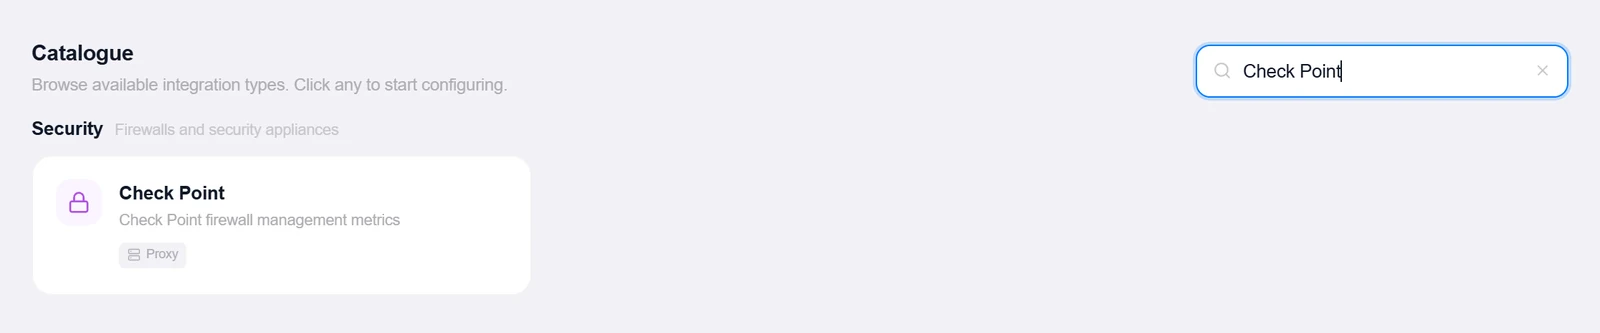
- Open the Integrations pageClick Integrations in the toolbar and pick Check Point from the catalogue.
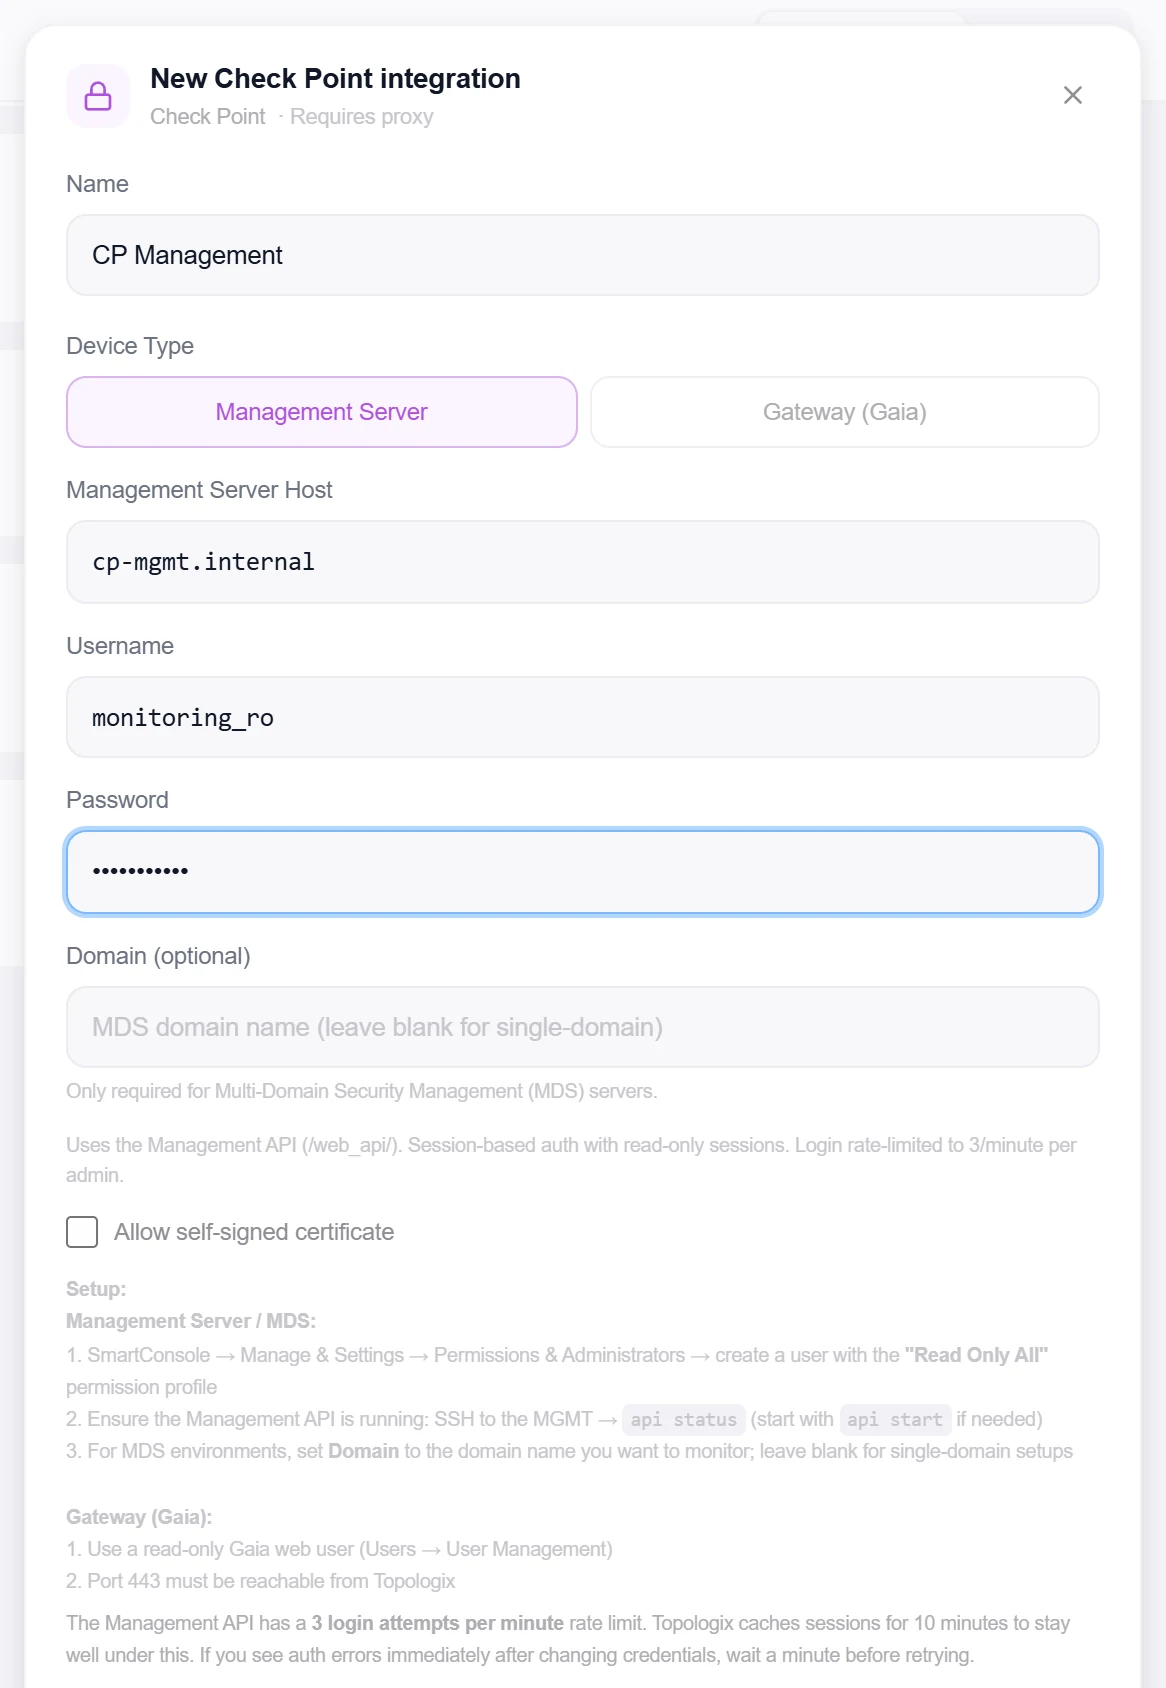
- Pick the device typeTwo tiles: Management Server or Gateway (Gaia).
- Enter host and credentialsHost, Username, Password. Management mode can use an API key instead of a password (SmartConsole → Manage & Settings → Administrators → the admin → Authentication Method: API key), and adds an optional Domain — required only on Multi-Domain (MDS) servers, to pick which domain to monitor; leave it blank on single-domain setups. Gateway mode adds the Management server picker and the rule-statistics throttles (statistics interval, deny-log window and row cap) — the defaults are safe for production firewalls.
- Create, then verifyClick Create, then reopen the integration and click Test — management reports "Connected — Management API vX", gateway reports "Connected — Gateway version (hostname)".
2 · Add it to a flow
- Select the nodeClick the node, open Metrics, then + Add and choose the Check Point integration.
- Add the sourceNo per-type options — one source covers the management server’s fleet view or the whole gateway.
- SaveSet the interval and click Add Source. Management: total / connected / disconnected gateways and how many have the access policy installed. Gateway: CPU, memory, cluster status and member states, interfaces up/total, per-poll drop/error/pps/throughput deltas, sensors where the platform exposes them, and concurrent connections.
3 · Firewall drops & permissions
The drops drill-down (the shield icon on a firewall card, and Infrastructure → Network (its Firewalls table)) combines three kinds of data, and each comes from a different place with its own permission. Nothing on this list needs an admin role on the gateway.
What each figure needs
Read this table first — the badge and the message on the drops dialog map one-to-one onto these rows.
- Gateway vitals (CPU, memory, interfaces, cluster, sensors): read-only Gaia calls on the gateway. Needs only the read-only Gaia user.
- Per-rule hits (which rule dropped what, totals and per-interval deltas):
show-access-rulebasewith hit counts on the Management server, targeted at this gateway. Needs the linked Management integration with a read-only admin (password or API key) — this is why a Gateway integration has a Management server picker. - Deny-log sampling (the log lines behind a rule, on demand):
show-logson the Management server. Same read-only admin; nothing on the gateway. - Drop reasons and DoS counters (
fwaccel stats -p,fwaccel dos stats): these are kernel counters that only a script on the gateway can read. Either the gateway's Gaia user may run scripts (a full Gaia role — not recommended for a monitoring account), or Topologix runs the same two commands through the Management server's Gaia API proxy, which needs no Gaia user on the gateway at all — only the Run One Time Script permission on the Management admin's profile. - Concurrent connections on the gateway card (
fw ctl pstat): the same script rule applies. With a read-only Gaia user the gateway card leaves this figure empty; the Management fleet card shows it once the script permission is in place.
Keep the gateway account read-only (recommended)
The intended setup: a read-only Gaia user on the gateway, a read-only admin on the Management server with one extra permission, and the two integrations linked.
- Link the gateway to its Management serverEdit the Gateway integration and pick the Management-mode integration under Management server. Rule hits and deny-log sampling start working on the next statistics interval.
- Allow the Management admin to run one-time scriptsIn SmartConsole open Manage & Settings → Permission Profiles, select the profile assigned to the Topologix admin (a copy of Read Only All works), go to Gateways → Scripts, enable Run One Time Script, then Publish. This is the only permission beyond read-only that Topologix ever uses; the gateway account itself gains nothing.
- Check the dialogOpen the drops drill-down. When the gateway's own Gaia user cannot run scripts, Topologix retries the two commands through the Management proxy automatically — the reasons list and the DoS tile fill in, and the badge goes to OK. Until the permission is granted the badge reads Partial and the message names the exact profile setting that is missing.
Reading the badge
The badge on the drops dialog and the Firewalls table of Infrastructure → Network summarise which of the sources above answered.
- OK — rule hits, reasons and DoS all present.
- Partial — the rulebase came back but a secondary source did not; the amber line says which one and what to grant (typically the run-script permission on one side or the other).
- No permission — the rulebase itself was refused: the Management admin lacks read access to the policy, is locked, or the gateway is not linked to a Management server.
- Stale — the last statistics window is older than the configured interval allows; the numbers shown are the previous sample.
If no script permission is acceptable at all
Even Run One Time Script lets an admin execute commands on managed gateways, so some organisations will not grant it. Per-rule hits and deny-log sampling still work fully read-only through the Management server. Drop reasons and DoS counters then stay empty — Check Point exposes no read-only API for those counters. SNMP on the gateway (the CHECKPOINT-MIB) offers read-only totals — dropped and rejected packets, connection table usage, per-interface drops — but no per-reason breakdown, and Check Point documents that SecureXL drops are not included in those totals.
Good to know
- The Management API rate-limits logins to 3 per minute per administrator, and each poll opens and closes its own read-only session — keep the interval at 60 s or more, and wait a minute before retrying after changing credentials.
- Sensor and per-interface-statistics endpoints differ across Gaia releases — Topologix probes the known variants and falls back to the counters embedded in the physical-interfaces response; virtual gateways that expose no sensors simply show no sensor rows.
- CPU and memory are computed to match cpview / SmartConsole (per-core idle averaged; memory as total minus available), so the card agrees with the Check Point GUI.
- Rule statistics are throttled on purpose: the rulebase-hits call runs every statistics interval (default 300 s) rather than every poll, and deny-log sampling is capped by the log window and row cap on the integration — raise them only on firewalls that can afford it.
More Security integrations
See it on your own infrastructure
Book a demo and we will walk you through Topologix with your systems in mind: on our cloud, or self-hosted in your own network.