Fortinet monitoring with Topologix
Security
FortiGate and FortiManager over their REST APIs with a bearer token. A FortiGate card carries firewall vitals — CPU, memory, session count, throughput and packets/sec, hardware sensors, HA state, interface health with per-poll drop/error deltas — plus SSL-VPN users and IPsec tunnel state when remote access is configured. A FortiManager card summarizes the managed fleet: devices online, offline, and out of sync.
Requirements
- A REST API admin token. FortiGate: System → Administrators → REST API Admin with the built-in
read_onlyadministrator profile. FortiManager: version 7.2.2+, an administrator with Standard_User or a read-only custom profile and JSON API Access: Read — older FortiManager versions don’t expose the endpoints Topologix needs. - The collector’s IP in the API admin’s Trusted Hosts list — FortiGate answers 403 to API calls from any untrusted source.
- HTTPS reach to the device from a proxy agent picked under Run on (firewall management interfaces rarely face the server directly); self-signed certificates are accepted with the toggle.
- Per-rule drops (which policy is dropping what): the API admin profile needs Firewall read + Log & Report read — the built-in
read_onlyprofile already has both.
1 · Set up the integration
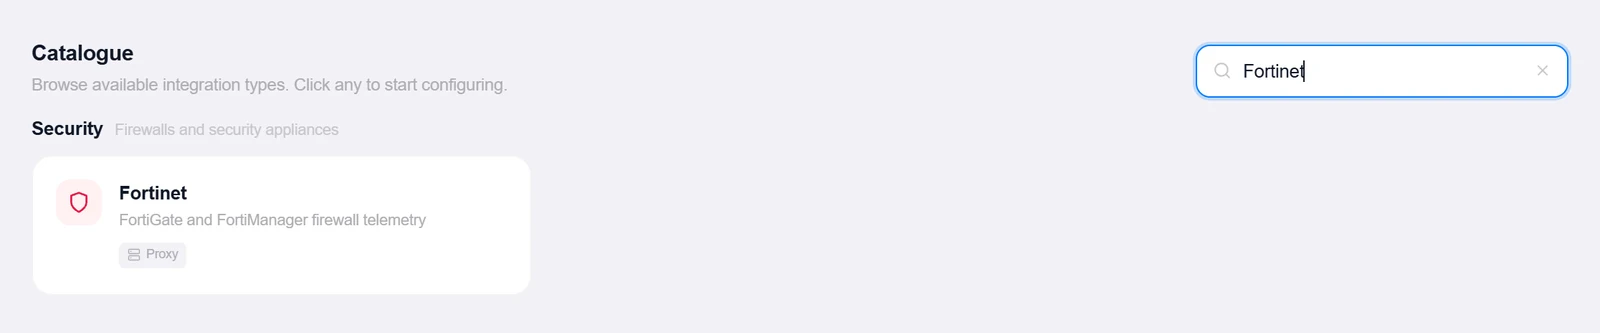
- Open the Integrations pageClick Integrations in the toolbar and pick Fortinet from the catalogue.
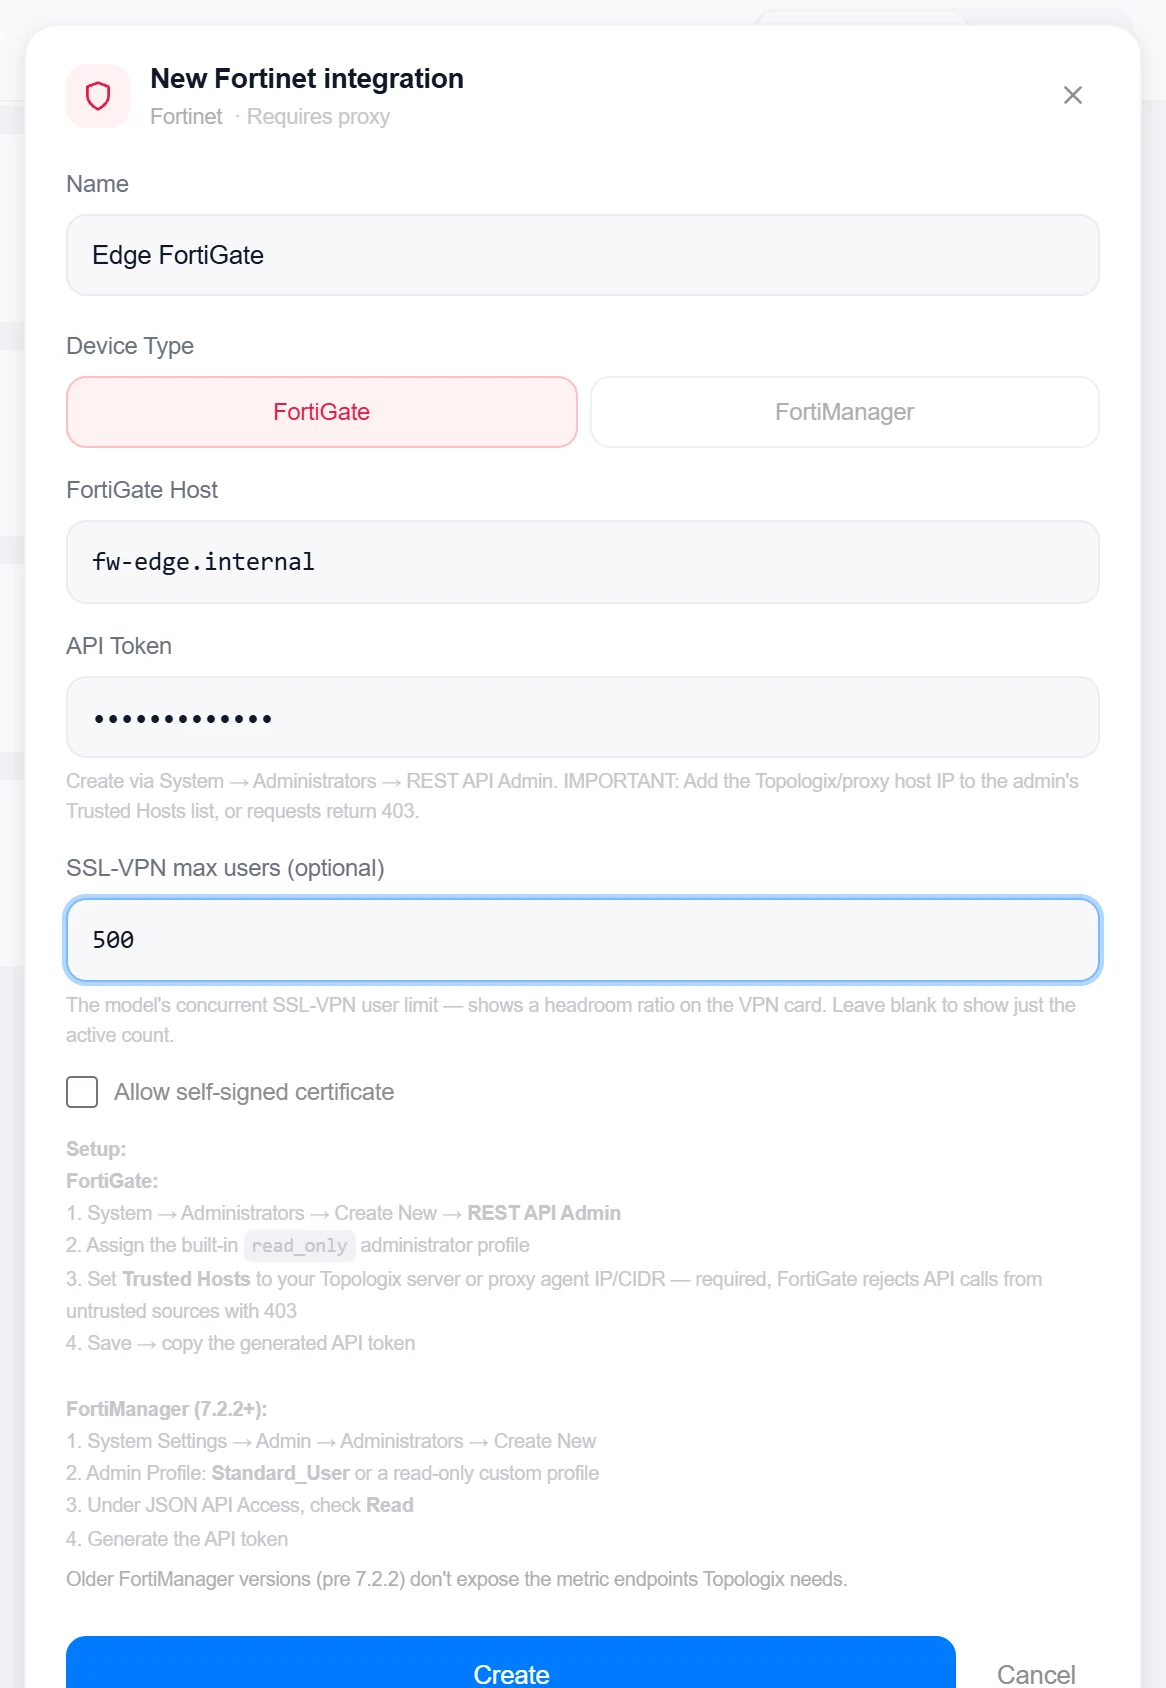
- Pick the device typeTwo tiles: FortiGate or FortiManager — the choice fixes what the card will show.
- Enter host and tokenFortiGate/FortiManager Host and API Token. FortiGate adds an optional SSL-VPN max users — the model’s concurrent-user limit, for a headroom ratio on the VPN card — plus the self-signed toggle.
- Create, then verifyClick Create, then reopen the integration and click Test — FortiGate reports "Connected — FortiGate version (hostname)", FortiManager the managed-device count. A 403 points at Trusted Hosts; a 429 at the device’s API rate limit.
Target on a private network? Route it through a proxy agent. Proxy agents run inside your network — behind NAT, on a management VLAN, in an air-gapped segment — and reach targets the Topologix server can't. The agent polls the server every 15 seconds for its assignments, runs the checks locally, and pushes results back every 5 seconds, so no inbound firewall rules are ever needed. Set a default proxy on the integration; every metric source can override it. If a proxy goes offline, its sources are marked stale within ~90 seconds and the last known values stay visible.
2 · Add it to a flow
- Select the firewall nodeClick the node, open Metrics, then + Add and choose the Fortinet integration.
- Add the sourceNo per-type options — one source is the whole appliance.
- SaveSet the interval and click Add Source. FortiGate: CPU (plus management-plane CPU where exposed), memory, sessions, throughput and pps, temperature/fan/PSU alarms, interfaces up/total with drop/error deltas, HA members, and the VPN block (SSL-VPN users with optional headroom ratio, IPsec tunnels up/total). FortiManager: total / online / offline / out-of-sync devices.
Live canvas screenshots for this integration require a real Fortinet environment, so this guide shows the configuration screens only — the flow steps above work exactly like every other integration.
Good to know
- Drop, error, and per-interface bps figures are deltas between polls — the first sample establishes the baseline and shows zeros.
- FortiGate-VM returns no sensor data, so temperature/fan/PSU rows simply stay absent on VMs — normal, not a fault. A FortiGate-VM evaluation license exists and is the easy lab path for trying the integration.
- The VPN block only appears when SSL-VPN or IPsec is actually configured; FortiOS doesn’t expose the model’s SSL-VPN user limit via the API, which is why the headroom capacity is a manual field.
More Security integrations
See it on your own infrastructure
Book a demo and we will walk you through Topologix with your systems in mind: on our cloud, or self-hosted in your own network.