AWS RDS monitoring with Topologix
Data & Storage
Per-instance RDS health from CloudWatch — CPU, connections, freeable memory, free storage, read/write IOPS and latencies — stitched to the instance’s own engine, version, status, class, and Multi-AZ flag from the RDS API. One integration per region; instances are picked from a discovered list, one source each.
Requirements
- An IAM access key that can call rds:DescribeDBInstances and cloudwatch:GetMetricData — the managed
AmazonRDSReadOnlyAccess+CloudWatchReadOnlyAccesspair, or a two-action custom policy. - The integration is region-scoped: the drawer’s Region select decides which instances are listed. Instances in other regions get their own integration on the same key.
1 · Set up the integration
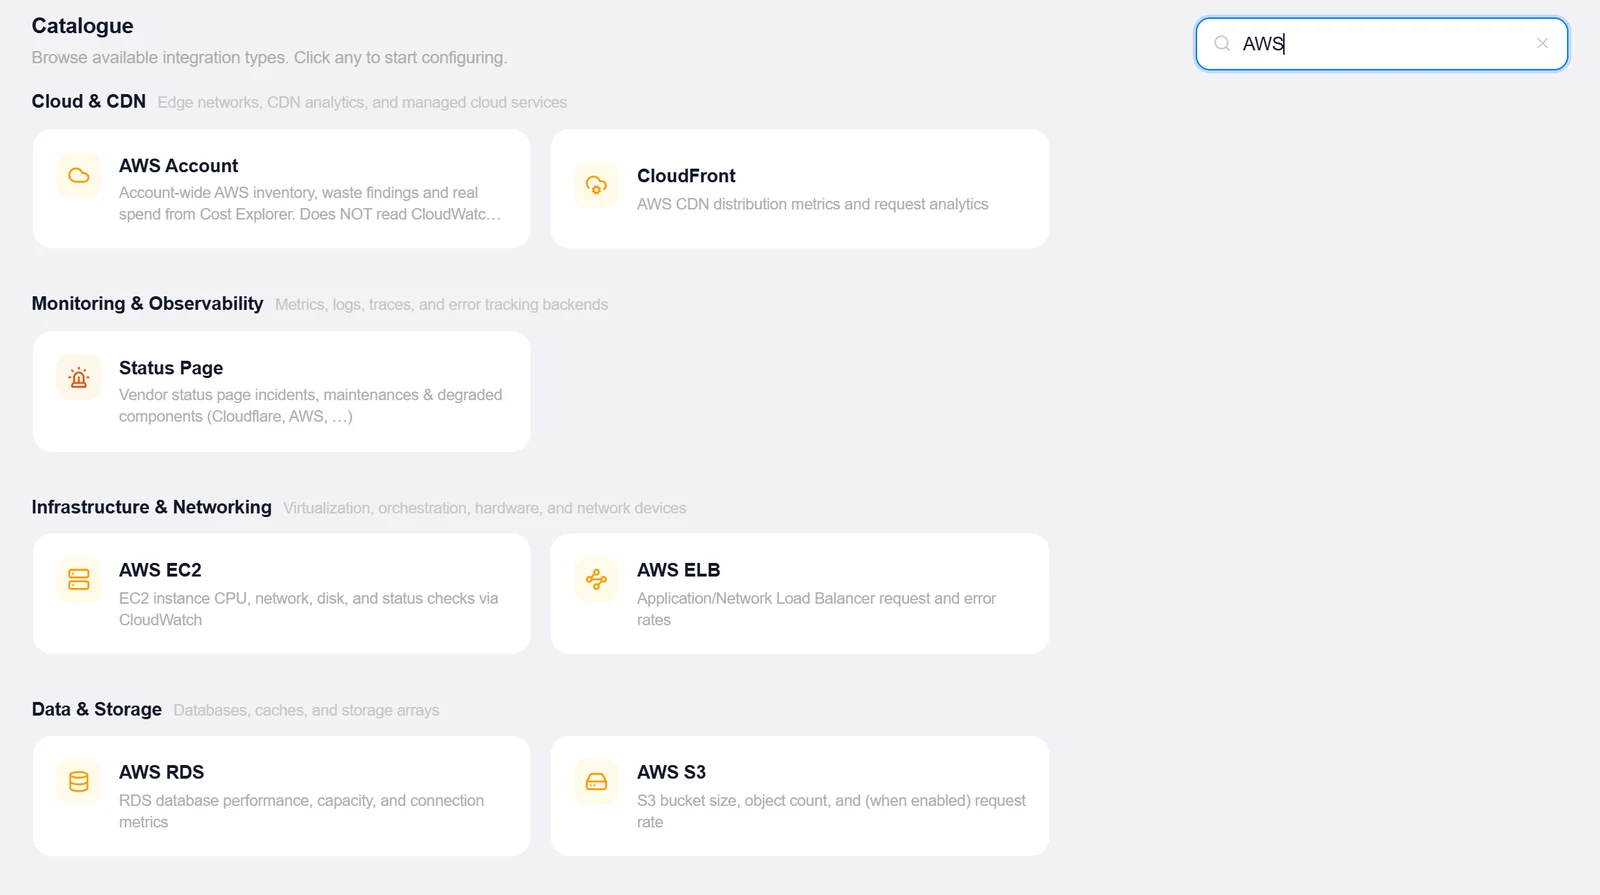
- Open the Integrations pageClick Integrations in the toolbar and pick AWS RDS from the catalogue.
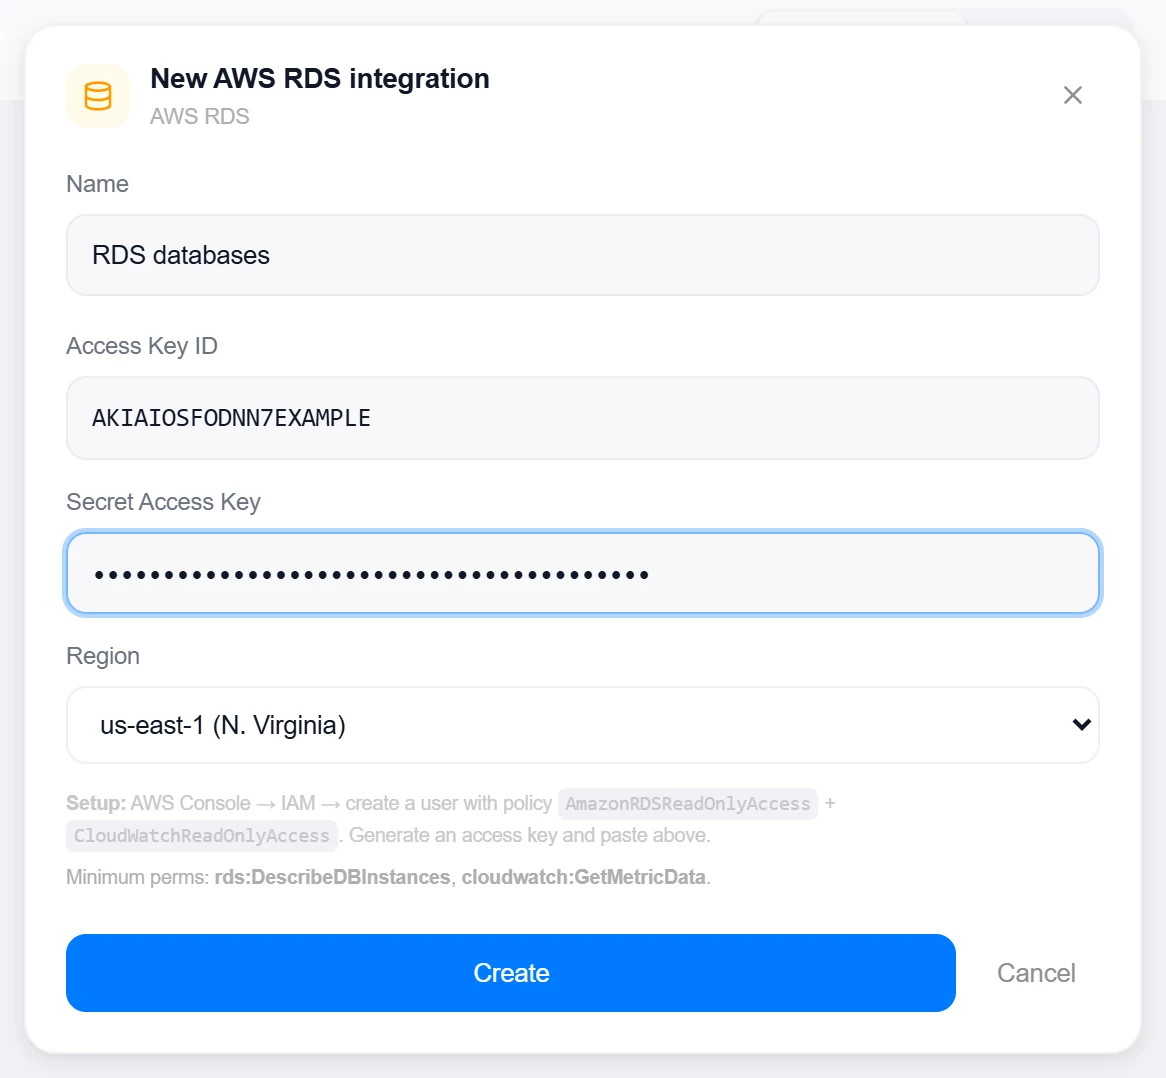
- Create a read-only IAM userAWS Console → IAM → create a user with
AmazonRDSReadOnlyAccess+CloudWatchReadOnlyAccessand generate an access key. - Enter the credentialsAccess Key ID, Secret Access Key, and the Region the databases live in.
- Create, then verifyClick Create, then reopen the integration and click Test — it lists DB instances and reports “Connected — N DB instance(s) in <region>”; an access-denied answer names the two required actions.
Target on a private network? Route it through a proxy agent. Proxy agents run inside your network — behind NAT, on a management VLAN, in an air-gapped segment — and reach targets the Topologix server can't. The agent polls the server every 15 seconds for its assignments, runs the checks locally, and pushes results back every 5 seconds, so no inbound firewall rules are ever needed. Set a default proxy on the integration; every metric source can override it. If a proxy goes offline, its sources are marked stale within ~90 seconds and the last known values stay visible.
2 · Add it to a flow
- Select the database nodeClick the node, open Metrics, then + Add and choose the AWS RDS integration.
- Pick the instancesA multi-select list of the region’s DB instances — each row shows engine, version, status, and the Multi-AZ flag — creates one source per ticked instance in a single pass; or paste a
DBInstanceIdentifierdirectly. - SavePick the period (1 minute to 24 hours) and click Add Source. The card combines the instance’s status line with the eight CloudWatch series.
Live canvas screenshots for this integration require a real AWS RDS environment, so this guide shows the configuration screens only — the flow steps above work exactly like every other integration.
Good to know
- Each poll is one
DescribeDBInstancesplus one batchedGetMetricDatafor all eight metrics;ReadLatencyandWriteLatencyarrive from CloudWatch in seconds and are converted to milliseconds on the card. - This is the per-resource half of the AWS story — utilization here; account-wide spend, waste, and inventory belong to the AWS Account integration, which deliberately reads no CloudWatch.
More Data & Storage integrations
See it on your own infrastructure
Book a demo and we will walk you through Topologix with your systems in mind: on our cloud, or self-hosted in your own network.