Hazelcast monitoring with Topologix
Data & Storage
Cluster safety at a glance for the Hazelcast in-memory data grid — node and cluster state, the cluster-safe flag, migration queue, member list, and partition state, read straight from the member REST endpoints.
Requirements
- The member REST API enabled with both the
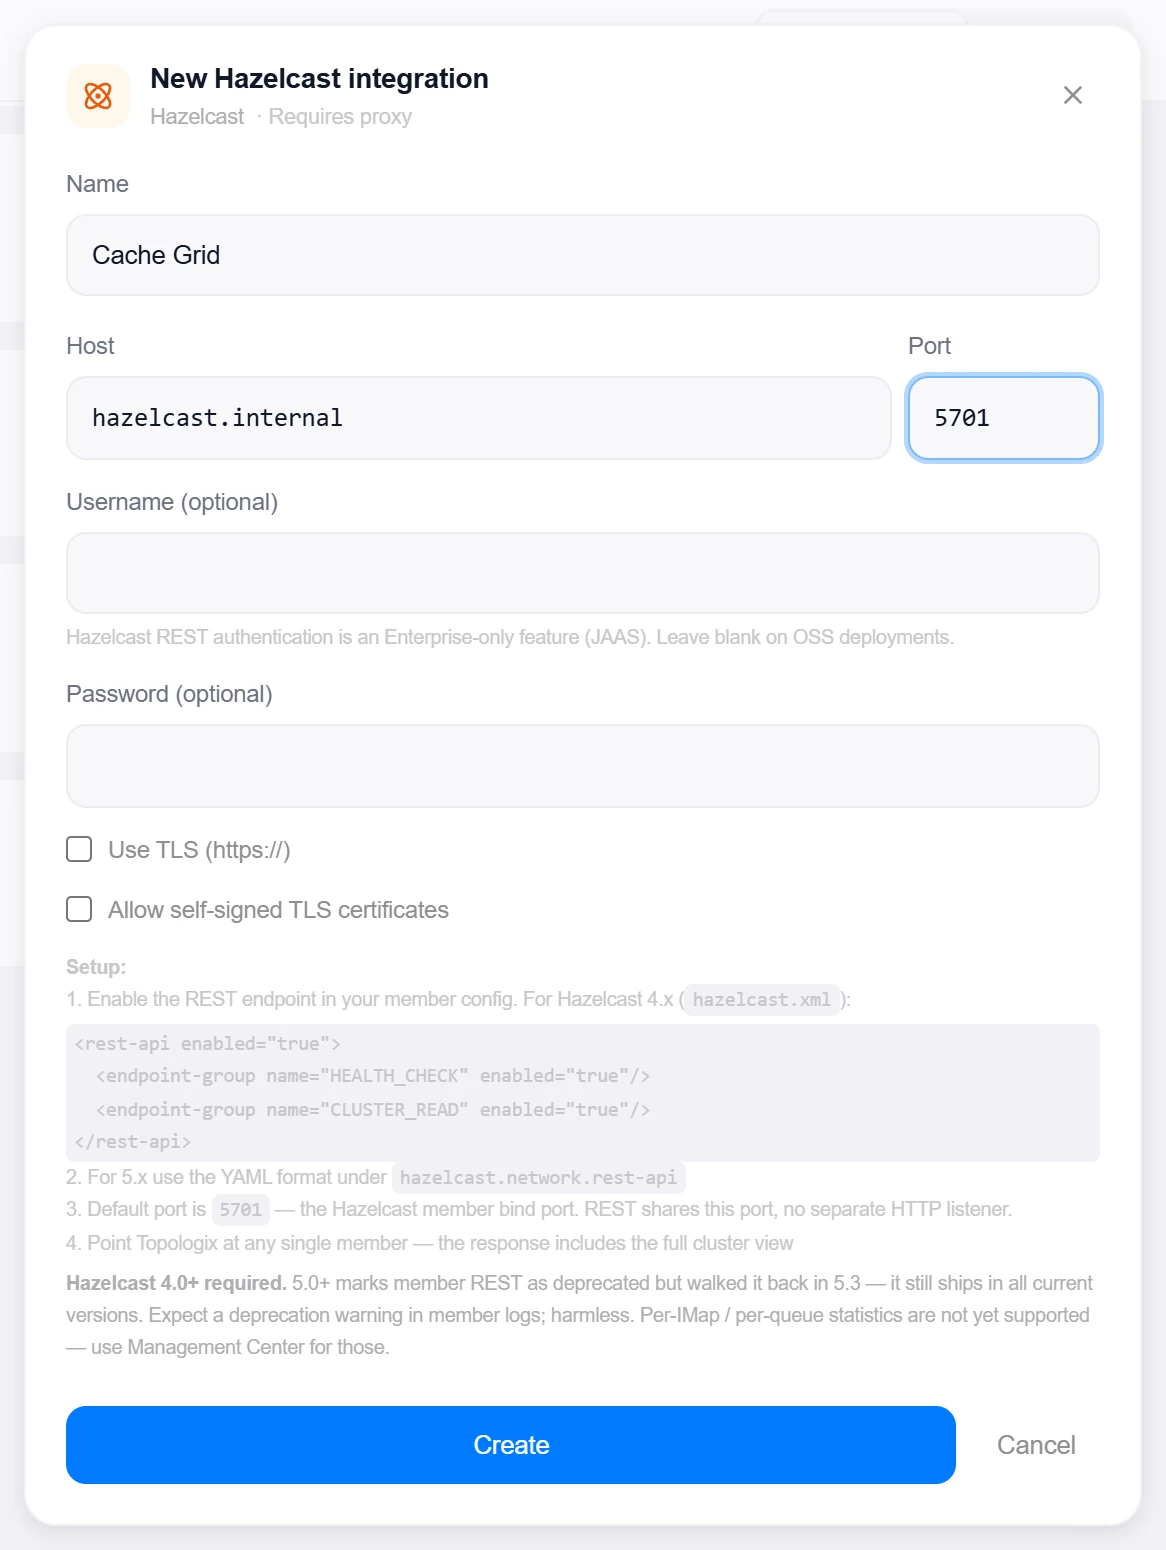
HEALTH_CHECKandCLUSTER_READendpoint groups (<rest-api enabled="true">inhazelcast.xml, orhazelcast.network.rest-apiin 5.x YAML). - Network reach from the Topologix server or a proxy agent to the member bind port (default 5701) — REST shares it, there is no separate HTTP listener.
- Credentials only on Enterprise deployments (REST auth is Enterprise-only JAAS); leave username/password blank on OSS.
1 · Set up the integration
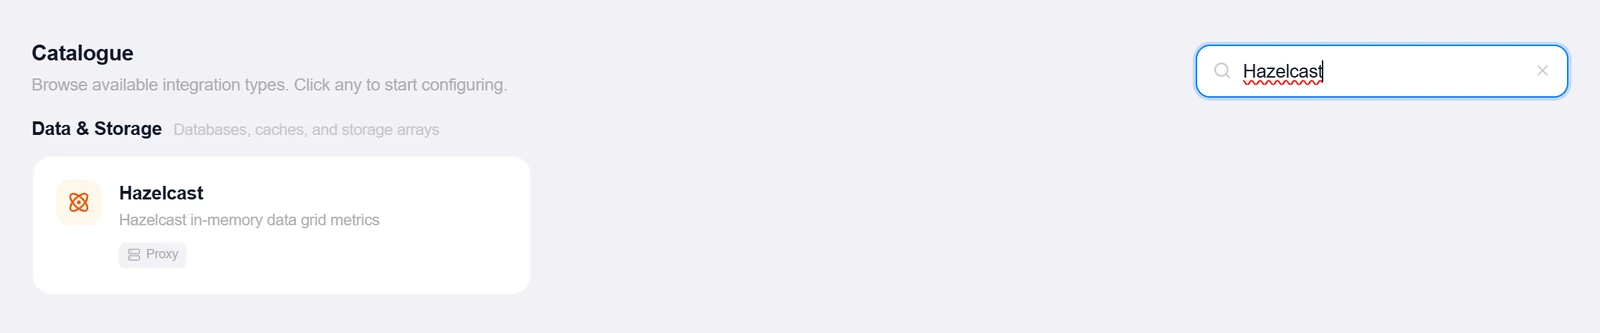
- Open the Integrations pageClick Integrations in the toolbar and pick Hazelcast from the catalogue.
- Enter host and portAny single member on port 5701 — its response includes the full cluster view. Use TLS (https://) and Allow self-signed TLS certificates toggles cover TLS-enabled members.
- Create, then verifyClick Create, then reopen the integration and click Test — it reports the Hazelcast version, cluster state, member count, and whether the cluster is safe. A disabled endpoint group is called out by name so you know exactly what to enable.
Target on a private network? Route it through a proxy agent. Proxy agents run inside your network — behind NAT, on a management VLAN, in an air-gapped segment — and reach targets the Topologix server can't. The agent polls the server every 15 seconds for its assignments, runs the checks locally, and pushes results back every 5 seconds, so no inbound firewall rules are ever needed. Set a default proxy on the integration; every metric source can override it. If a proxy goes offline, its sources are marked stale within ~90 seconds and the last known values stay visible.
2 · Add it to a flow
- Select the grid nodeClick the node, open Metrics, then + Add and choose the Hazelcast integration.
- Add the sourceNo per-type options — one source covers the cluster as seen from the configured member.
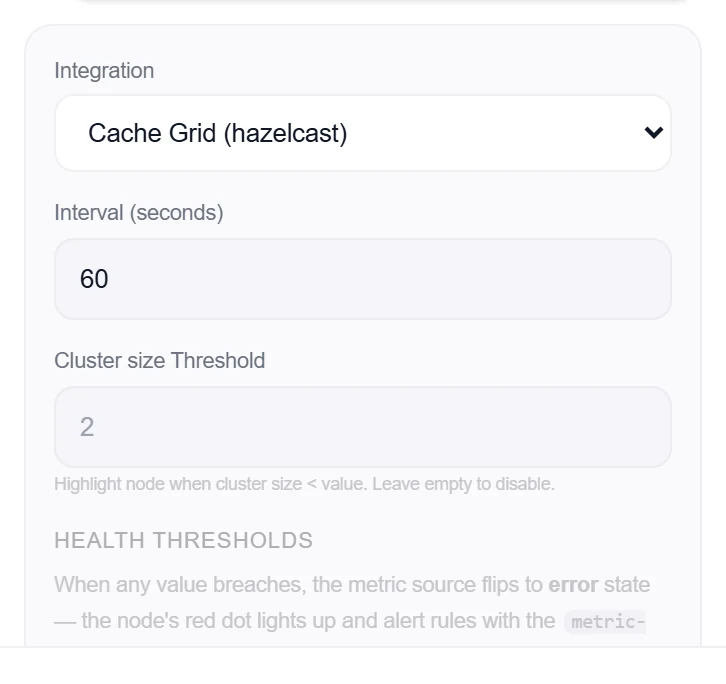
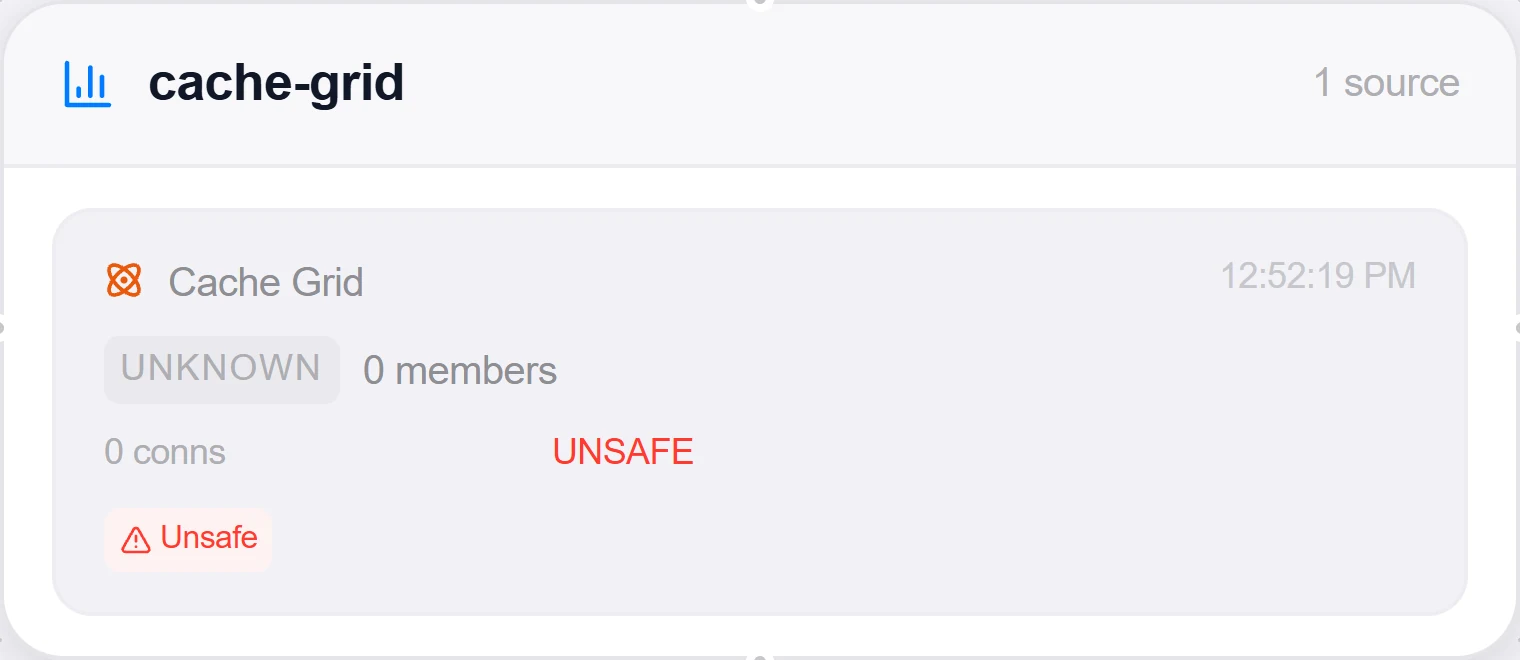
- SaveSet the interval and click Add Source. The card shows cluster state, member count, the cluster-safe flag, and the migration queue — an unsafe cluster or a shrinking member list is immediately visible.
Good to know
- Hazelcast 4.0+ is required, and the fetcher parses the legacy plaintext health output. Builds whose REST endpoints return JSON instead (seen on 5.3.8) are not parsed — Test fails with “REST API is not enabled” even though REST is up; pin 5.1/5.2 if you hit this.
- 5.0+ marks member REST as deprecated (walked back in 5.3) — expect a harmless deprecation warning in member logs.
- Per-IMap / per-queue statistics are not exposed here — use Management Center for data-structure-level detail.
More Data & Storage integrations
See it on your own infrastructure
Book a demo and we will walk you through Topologix with your systems in mind: on our cloud, or self-hosted in your own network.