Apache NiFi monitoring with Topologix
Data & Storage
Apache NiFi flow health from the REST API — JVM heap, repository usage, backpressure, queue depth, bulletins, and cluster state in one health suite, plus 16 single-metric presets across JVM, repositories, flow throughput, and queue health.
Requirements
- The NiFi REST API over HTTPS with a username/password login (single-user or LDAP) — Topologix fetches and refreshes the JWT itself.
- Network reach from the Topologix server or a proxy agent to the NiFi port (default 8443). NiFi’s default self-signed certificate is accepted by unticking Verify TLS certificate.
1 · Set up the integration
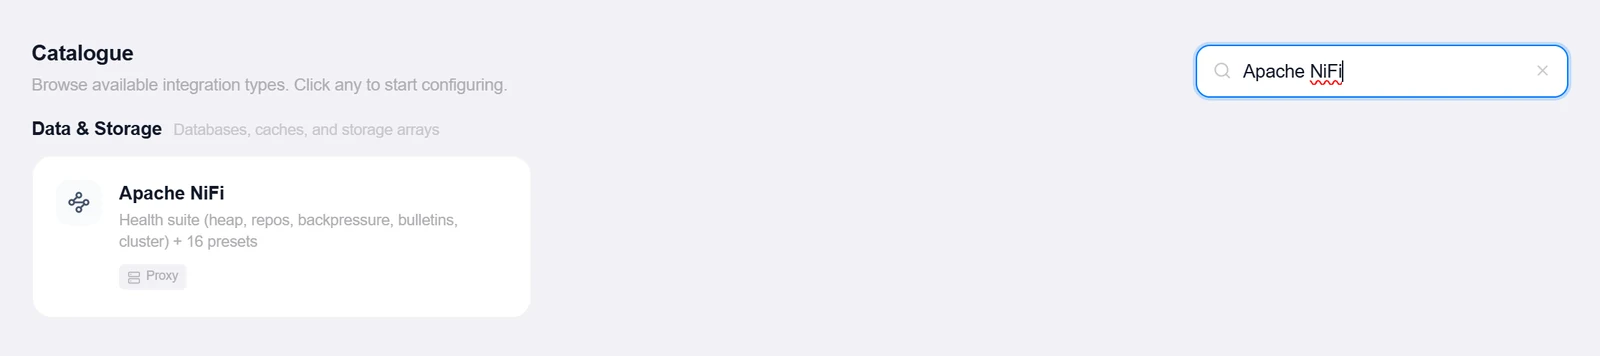
- Open the Integrations pageClick Integrations in the toolbar and pick Apache NiFi from the catalogue.
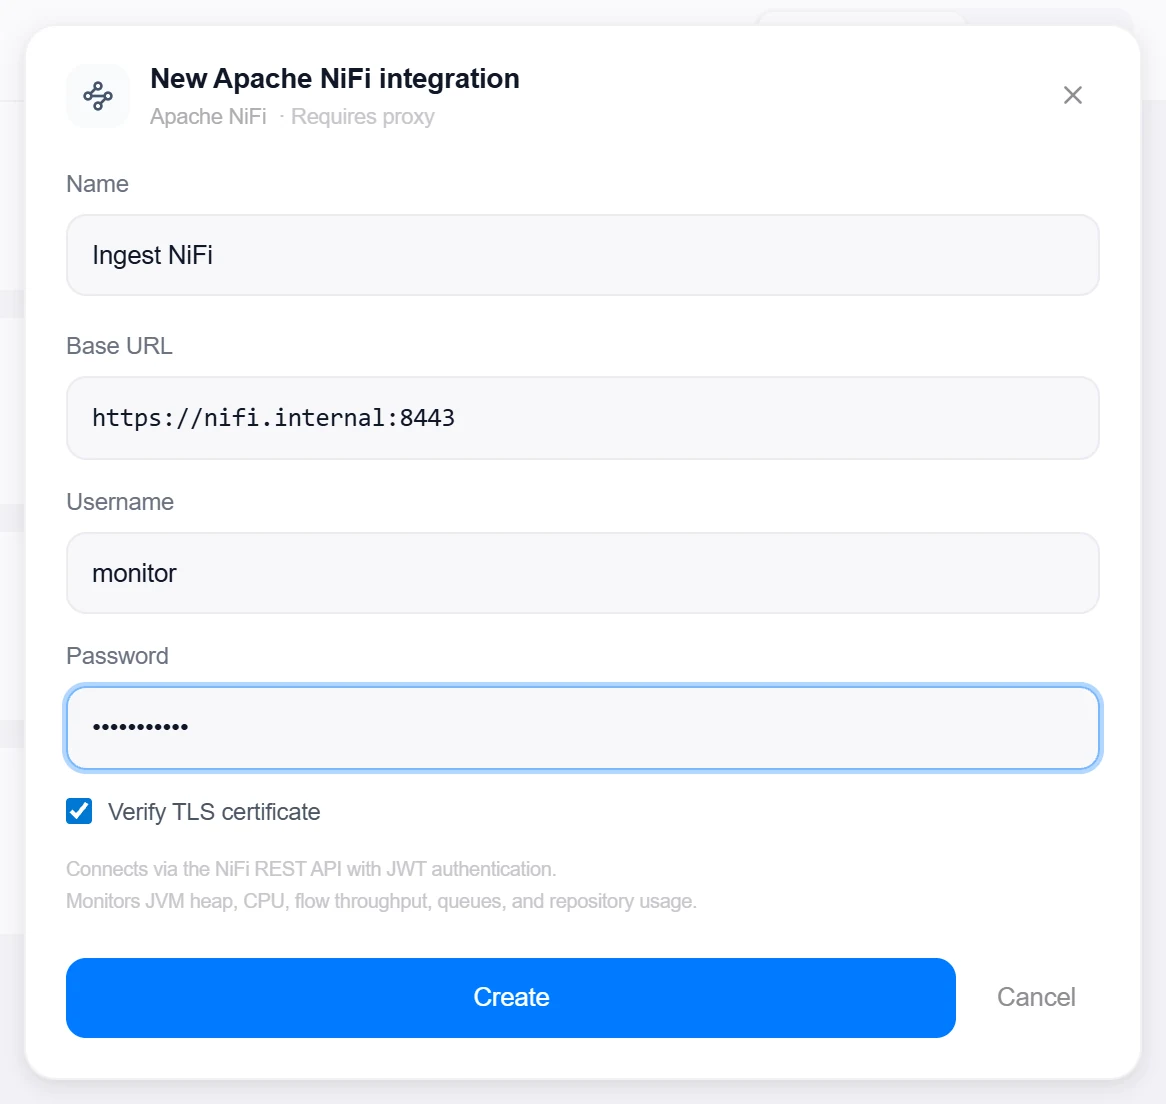
- Enter the base URL and credentials
https://nifi:8443— without the/nifi-apisuffix — plus Username and Password. - Create, then verifyClick Create, then reopen the integration and click Test — it authenticates, reads the system diagnostics, and reports the NiFi version and uptime. A 404 here means the base URL includes
/nifi-apiwhen it shouldn’t.
2 · Add it to a flow
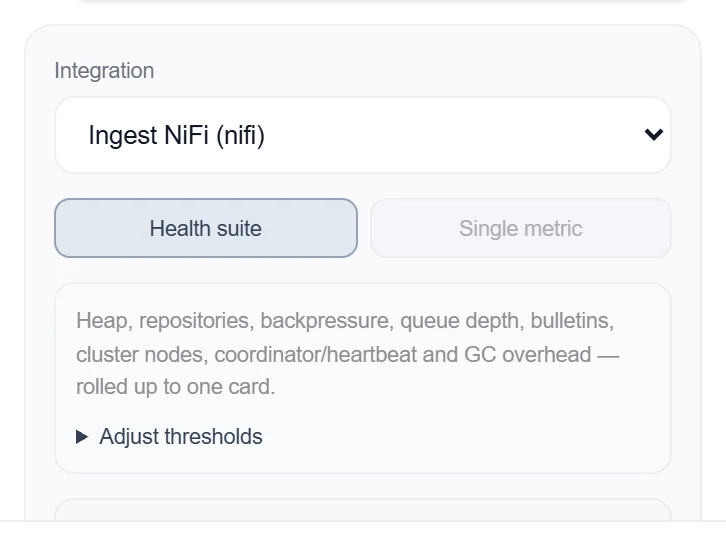
- Select the NiFi nodeClick the node, open Metrics, then + Add and choose the NiFi integration.
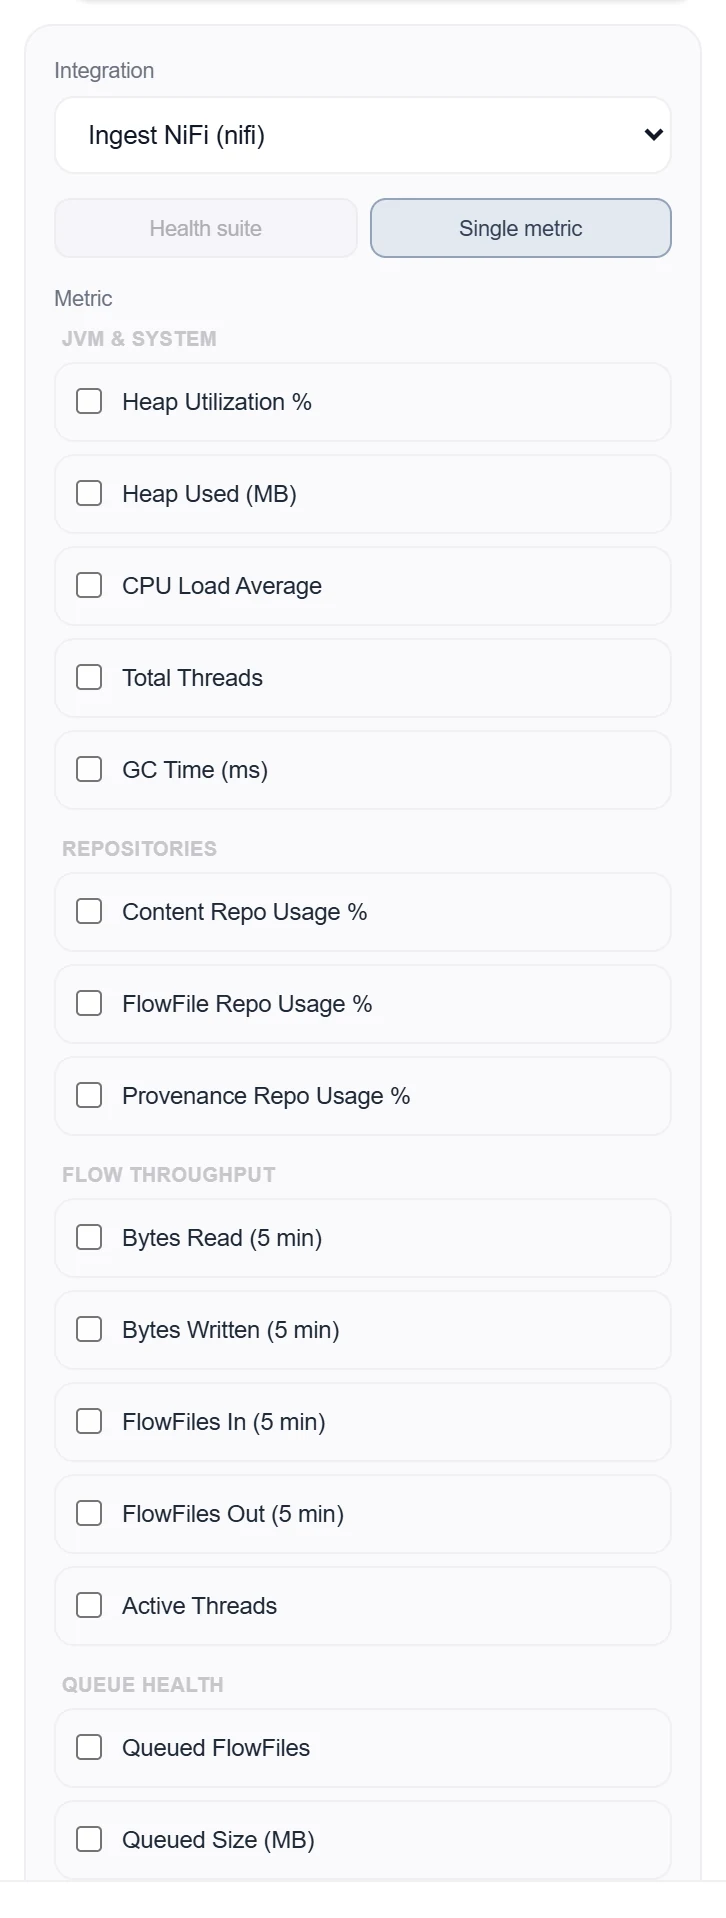
- Pick a modeTwo tabs: Health suite (the default) rolls heap, repositories, backpressure, queue depth, bulletins, cluster nodes, coordinator/heartbeat, and GC overhead into one card; Single metric charts one preset — multi-select creates one source per metric.
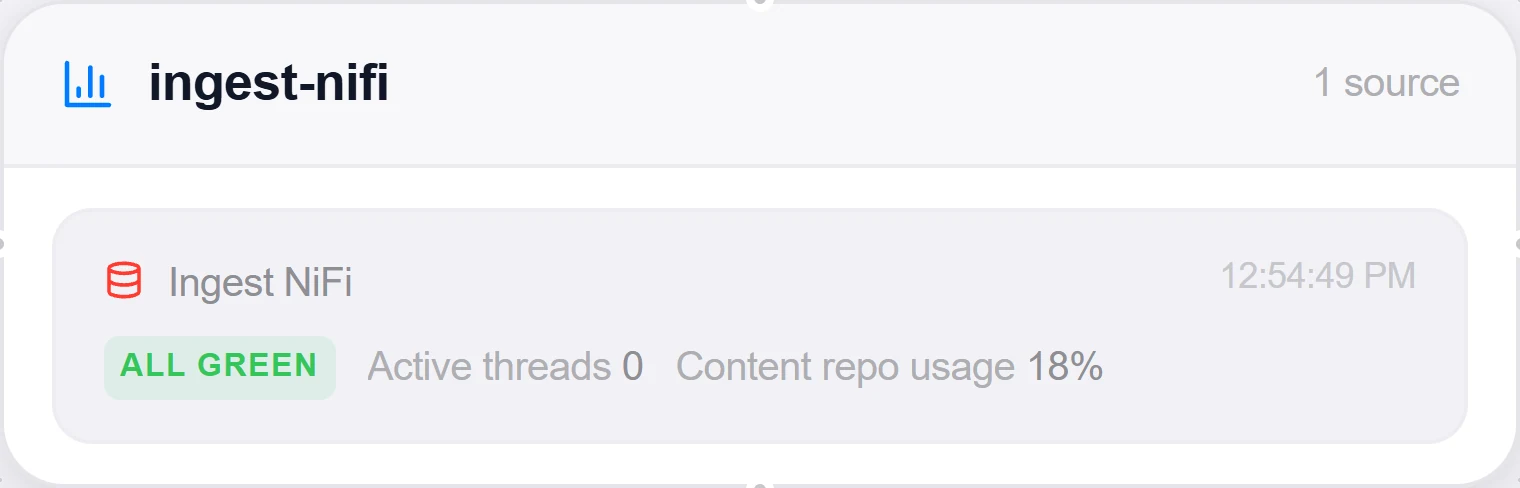
- SaveOptionally adjust per-check thresholds, set the interval, and click Add Source. Health failures turn the node red and drive alert rules per check.
3 · Beyond presets: custom queries & the All-Services alarm
Health suite
NiFi up, heap utilization, worst repository usage (content, FlowFile, and provenance are all scanned — including multiple configured repos), connection backpressure, queued FlowFiles, invalid components, error and warning bulletins, cluster node count, coordinator presence, node heartbeat age, GC overhead, and active threads.
- Invalid components come with their names, group path, and — when NiFi will share them — the actual validation errors, cached so a stable broken component doesn’t cost extra API calls every tick.
- Endpoints are fetched independently: one that 403s or times out degrades its checks to “n/a” instead of failing the whole source.
Single metric
One preset, one number: heap %, CPU load, GC time, per-repository usage %, bytes/FlowFiles in and out over the last 5 minutes, active threads, queued FlowFiles and bytes, or running components. Ticking several presets creates one source per metric in a single pass.
- Throughput presets read the root process-group status — the numbers match the NiFi canvas header, not the always-zero controller counters of newer NiFi versions.
Good to know
- Backpressure is evaluated per connection against NiFi’s own count and size thresholds — whichever is closer to its limit is the binding pressure, exactly as the NiFi UI colors it.
- The JWT is cached and re-fetched automatically — including a one-shot retry when NiFi invalidates tokens early (e.g. after a restart).
More Data & Storage integrations
See it on your own infrastructure
Book a demo and we will walk you through Topologix with your systems in mind: on our cloud, or self-hosted in your own network.