ClickHouse monitoring with Topologix
Data & Storage
A zero-configuration ClickHouse health suite — queries, memory, parts and merges, replication, Keeper session, distributed DDL, mutations, detached parts, disk-free — plus 20 system-table presets and custom SQL, all over the HTTP interface.
Requirements
- The HTTP interface — default port 8123 (8443 for HTTPS), not the native protocol on 9000.
- A user that can read the
system.*tables (thedefaultuser works out of the box); checks that hit missing grants degrade to “n/a” instead of failing the source. - Network reach from the Topologix server or a proxy agent to that port.
1 · Set up the integration
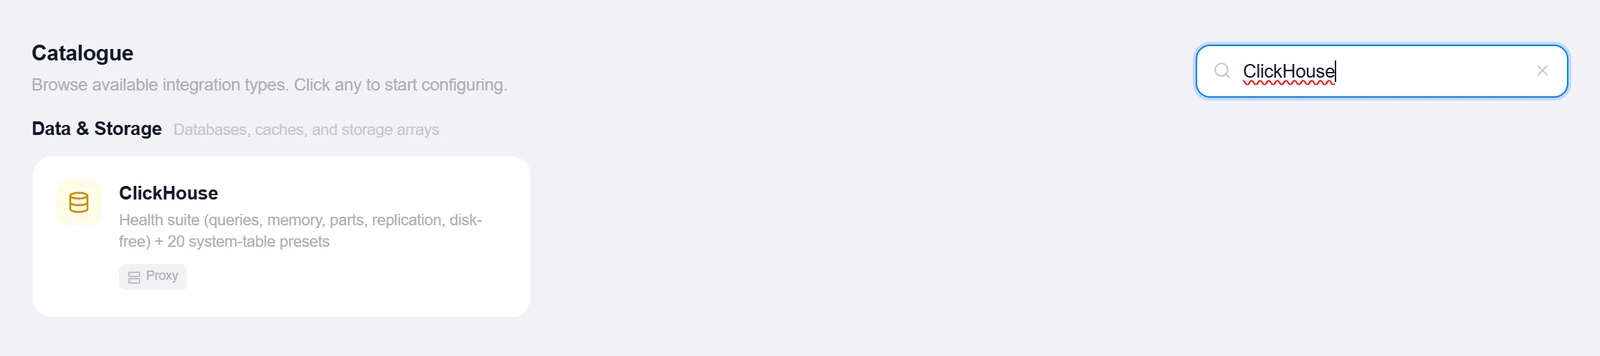
- Open the Integrations pageClick Integrations in the toolbar and pick ClickHouse from the catalogue.
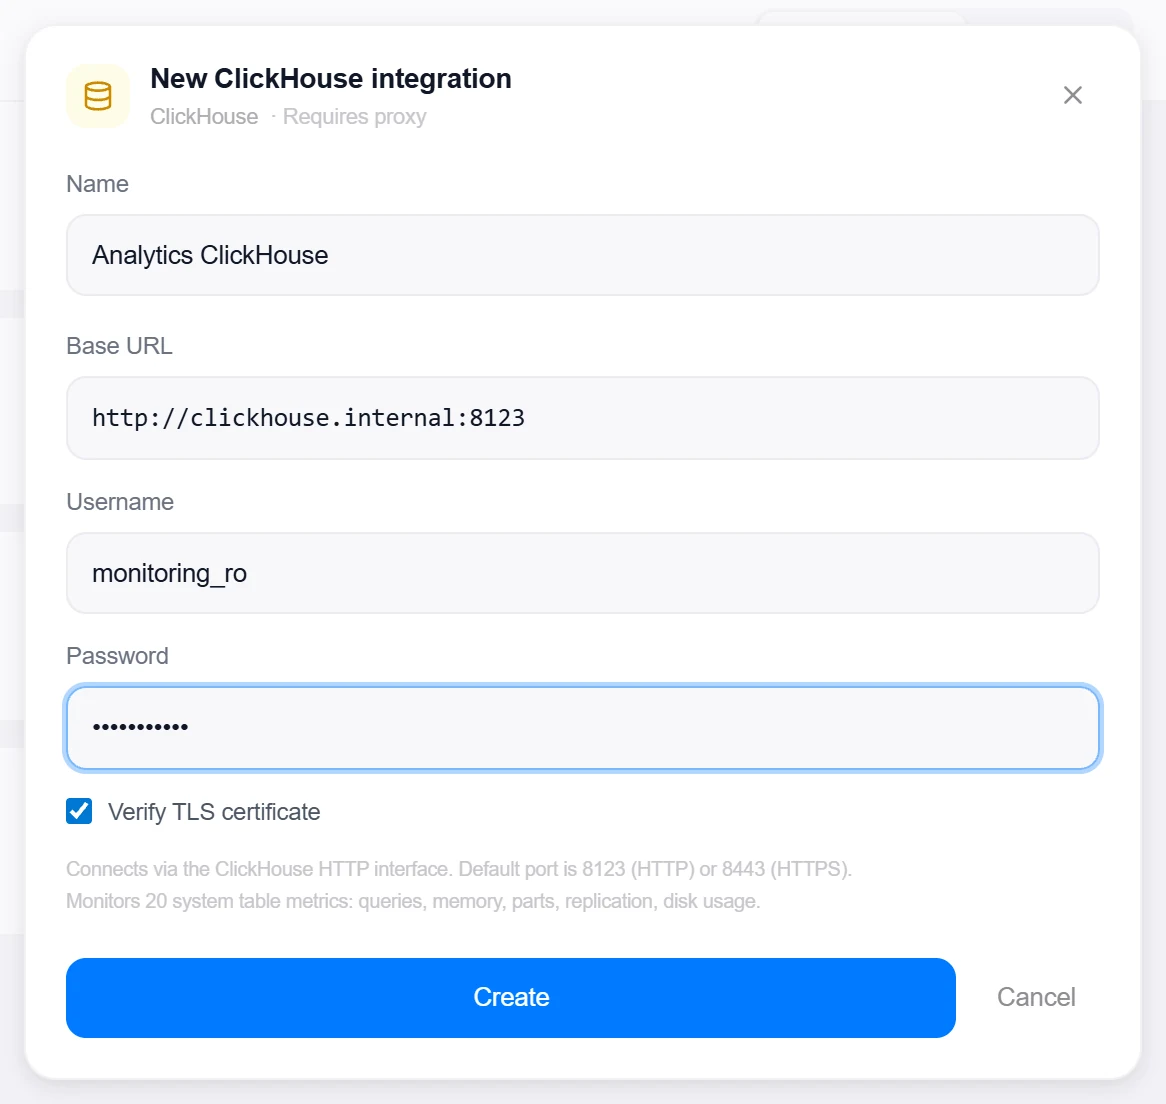
- Enter the base URL and credentials
http://clickhouse:8123, Username (typicallydefault) and Password; untick Verify TLS certificate for self-signed HTTPS. - Create, then verifyClick Create, then reopen the integration and click Test — it runs
SELECT version()and reports the ClickHouse version it found.
2 · Add it to a flow
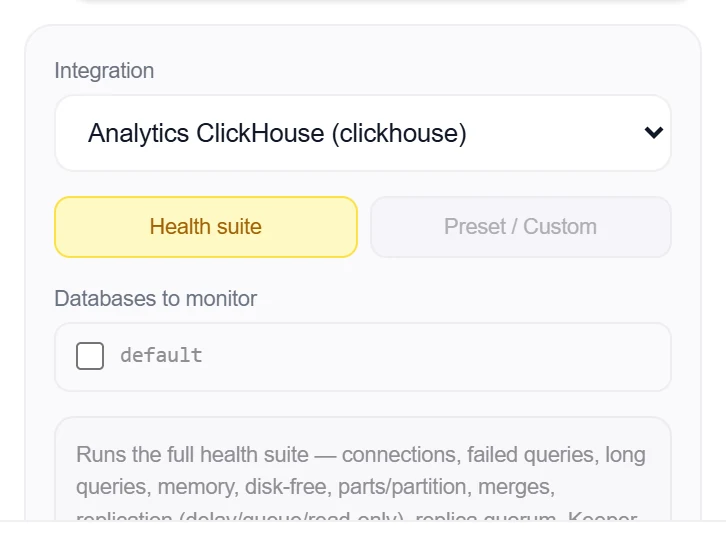
- Select the database nodeClick the node, open Metrics, then + Add and choose the ClickHouse integration.
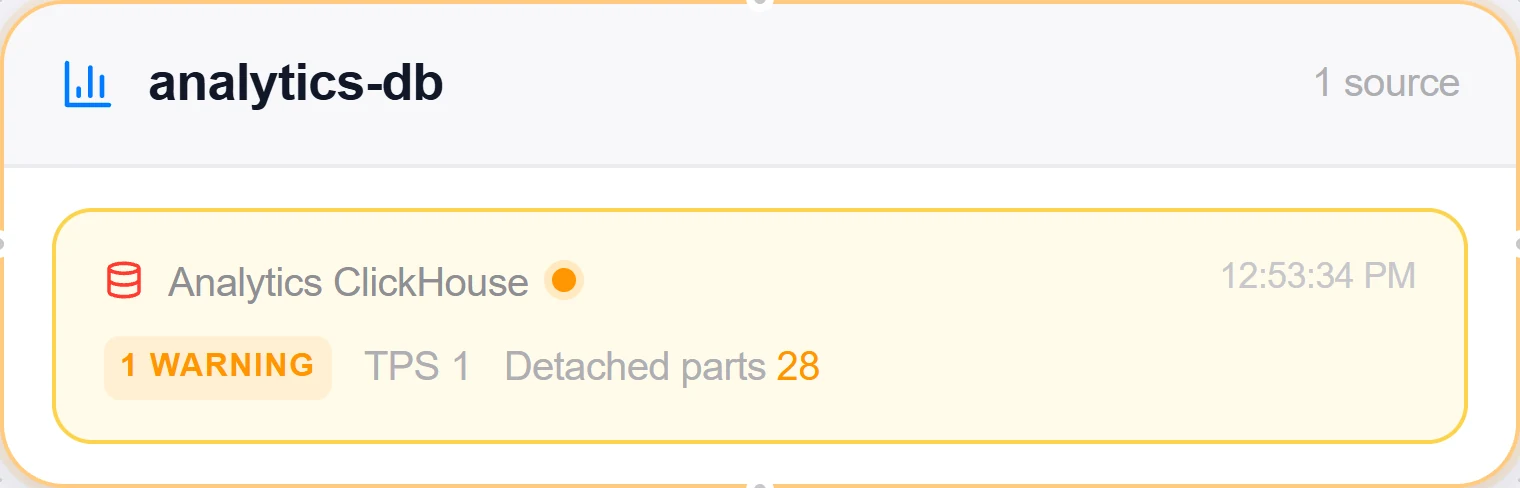
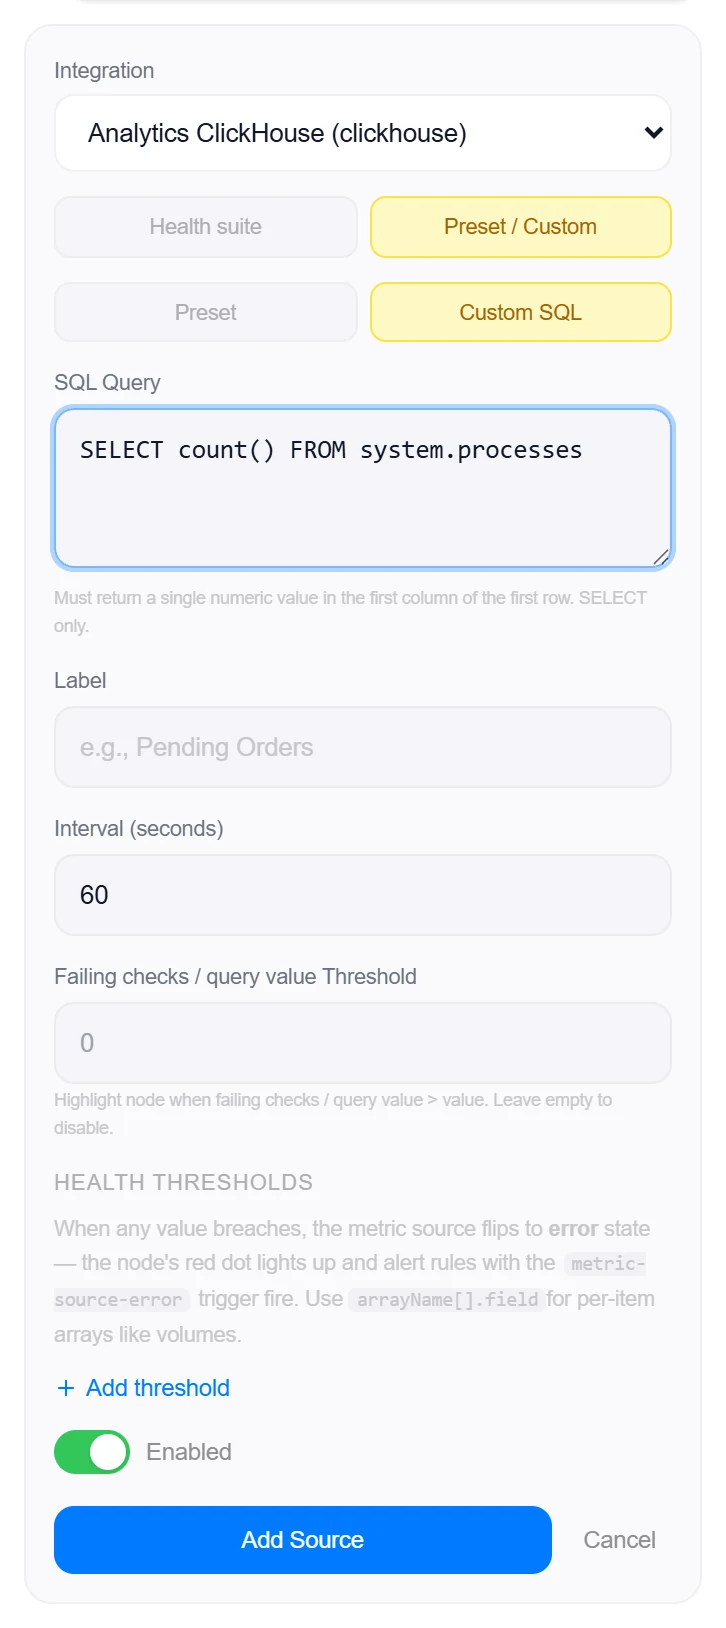
- Pick a modeTwo tabs: Health suite (the default) runs the full check suite and paints pass/fail chips on the card; Preset / Custom charts one number instead — a preset from the registry or your own SQL.
- SaveIn health mode, optionally tick databases for a per-database size breakdown (instance checks run once either way). Set the interval and click Add Source.
3 · Beyond presets: custom queries & the All-Services alarm
Health suite
One source, the whole instance: connections saturation, failed queries, long-running queries, server memory, disk free, max parts per partition, active merges, replica delay/queue/read-only state, replica quorum, Keeper session, cluster replica reachability, distributed DDL queue, stuck mutations, replication-queue errors, and detached parts.
- Replication, Keeper, and cluster checks read “n/a” on a standalone server rather than failing — the suite adapts to what the instance actually runs.
- Counter-based checks (failed queries, throughput) are computed as deltas between polls, so the first sample reads “n/a” and every later one is a true rate.
Custom SQL
Inside the Preset / Custom tab, a nested toggle picks Preset or Custom SQL. Custom queries must return a single numeric value in the first column of the first row — perfect for business metrics living in ClickHouse (SELECT count() FROM events WHERE event_date = today()).
- SELECT/WITH only — DDL and mutation keywords are rejected, multi-statement queries are blocked, and the query runs with
readonly=1so it cannot write even in principle. LIMIT 1is appended automatically when missing, keeping accidental full-result queries cheap.
Good to know
- Replication (DB-3). ClickHouse replication is symmetric, so a replicated server is shown as a peer: the other cluster hosts from
system.clusters, and the worst replica delay and queue depth fromsystem.replicas; a server with no replicated tables is standalone, and an unreadable view is reported as unreadable rather than as “no replication”. On the Databases page every source gains a Replication section on both ends of a link: the primary lists each standby with its lag and what it retains for it, the replica shows the server it replicates from and how far behind it is. Replicas are paired automatically from what the engines report about each other (exact IP, then DNS name, then name) and can be pinned or switched off per source; a replica’s numbers are read from its own source’s stored results, so no credential ever travels between servers. Amber follows the source’s own warn thresholds; red is a categorical failure (a disconnected standby, a stopped thread) or five to ten times the warn level. Proxy agents older than 1.151.0 do not report replication and the section says so rather than reading “standalone”. - ClickHouse errors surface with the server’s own exception text — a bad query or missing grant reads exactly like it would in
clickhouse-client.
More Data & Storage integrations
See it on your own infrastructure
Book a demo and we will walk you through Topologix with your systems in mind: on our cloud, or self-hosted in your own network.