MSSQL Server monitoring with Topologix
Data & Storage
SQL Server health without an agent — connections, throughput, buffer cache, memory, storage, and Always On AG health from a DMV check suite, backed by 23 DMV presets. Credentials live on the integration; each metric source points at its own host, so one integration covers the whole estate.
Requirements
- A monitoring login with VIEW SERVER STATE + VIEW ANY DEFINITION, and
db_datareaderonmsdbfor the backup and SQL Agent job checks. - TDS reach from the Topologix server or a proxy agent to the instance port (default 1433). Encrypt connection and Trust server certificate toggles cover the usual TLS setups.
- Statement statistics (optional): switch Query Store on for each monitored database —
ALTER DATABASE [db] SET QUERY_STORE = ON (OPERATION_MODE = READ_WRITE);— and give the login VIEW DATABASE STATE there. It is a per-database setting and the system databases cannot have it, so point the source at a user database. Without Query Store Topologix falls back to the plan cache (sys.dm_exec_query_stats, which only reaches back to the last restart or cache flush) and needs VIEW SERVER STATE.
1 · Set up the integration
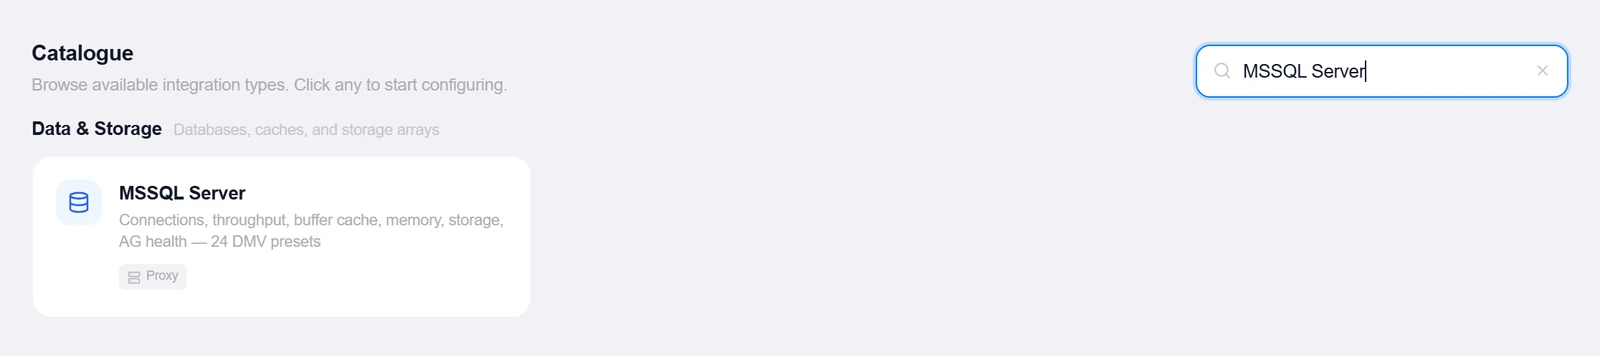
- Open the Integrations pageClick Integrations in the toolbar and pick MSSQL Server from the catalogue.
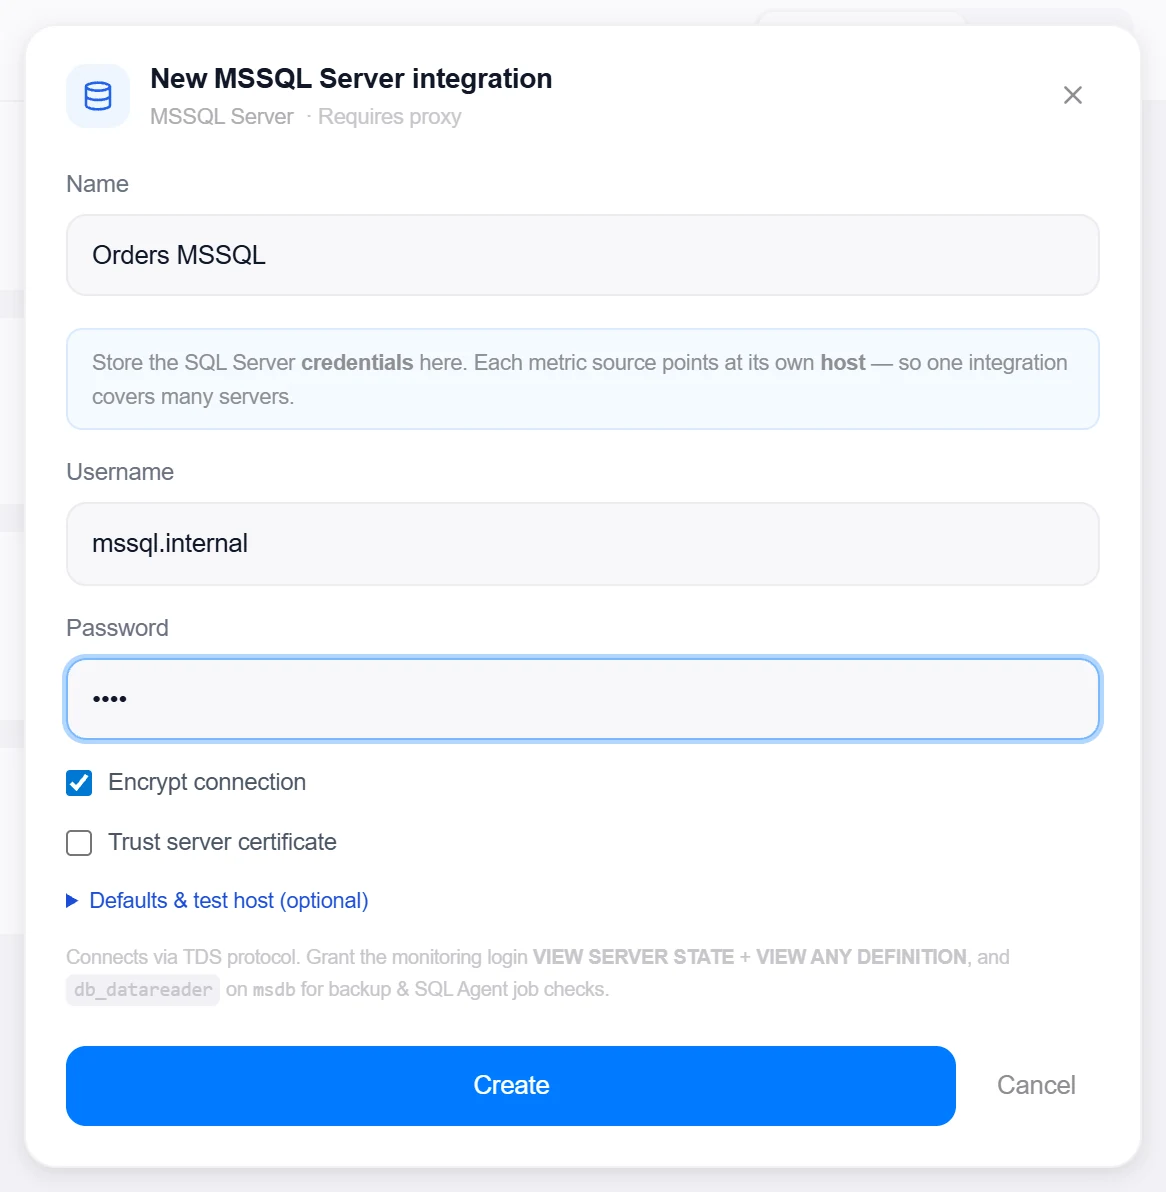
- Enter the credentialsJust Username and Password — the host lives on each metric source. An optional Defaults & test host section sets a fallback host, port, and default database (
master). - Create, then verifyClick Create, then reopen the integration and click Test — it connects to the default host and reports the first line of
@@VERSION.
2 · Add it to a flow
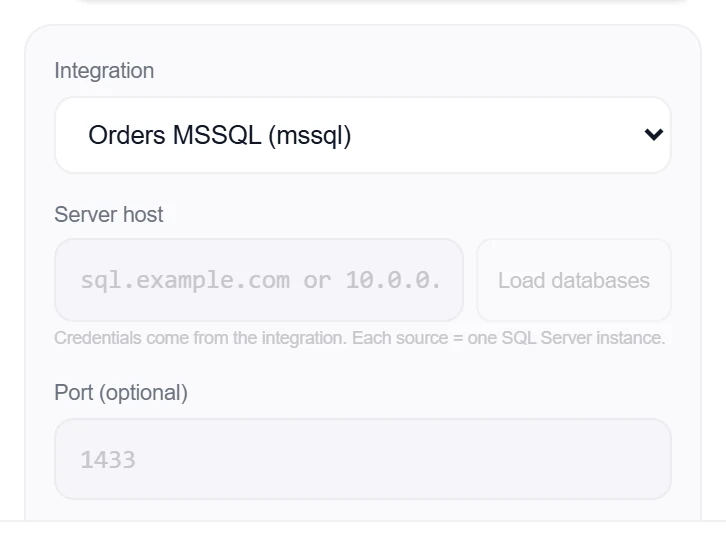
- Select the database nodeClick the node, open Metrics, then + Add and choose the MSSQL integration. Enter the Server host (and optional port) — Load databases discovers the instance’s databases for the pickers.
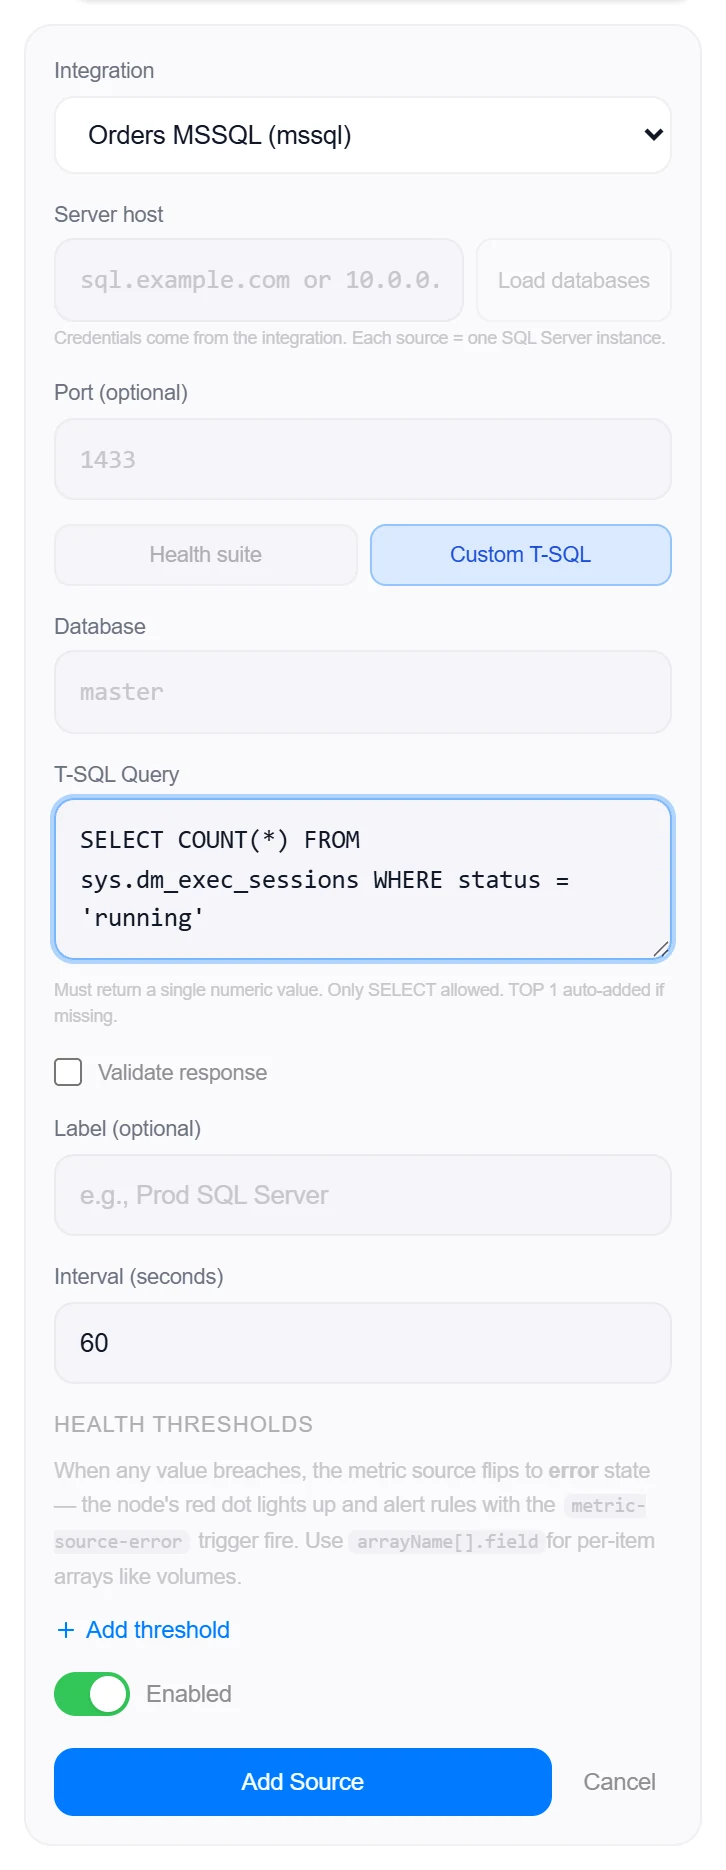
- Pick a modeTwo tabs: Health suite (the default) runs the full DMV check suite; Custom T-SQL charts a single number from your own query.
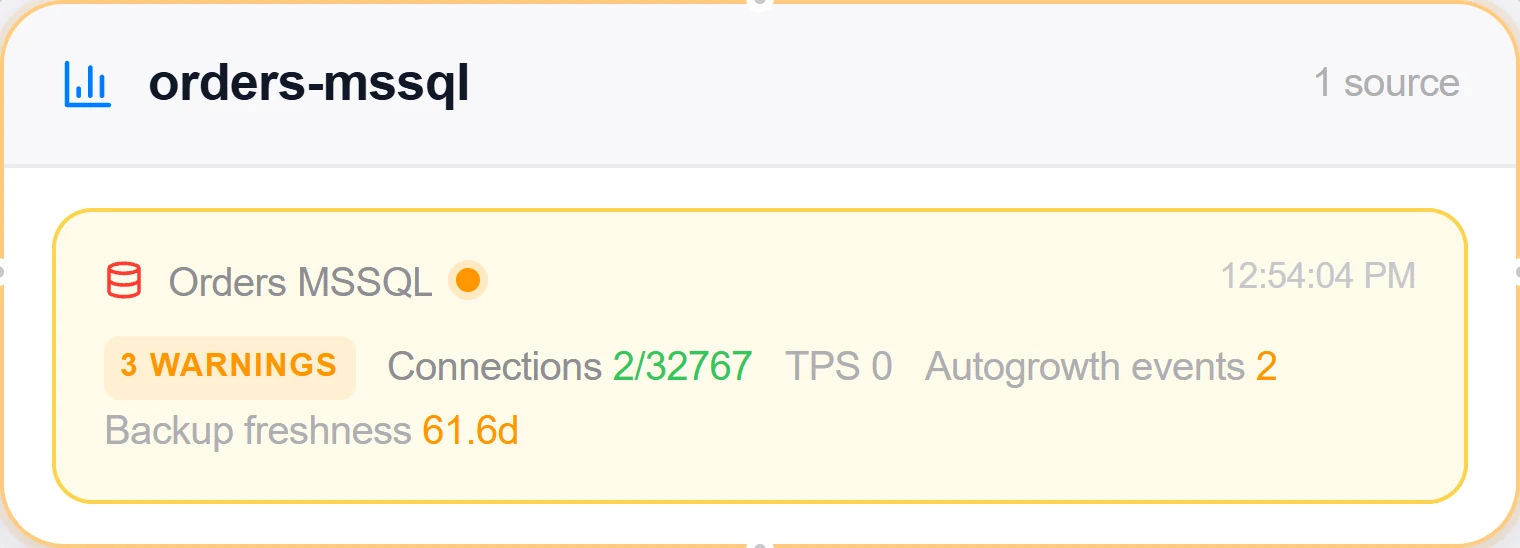
- SaveSet the interval and click Add Source. Health failures turn the node red; every check can drive alert rules individually.
3 · Beyond presets: custom queries & the All-Services alarm
Health suite
Instance checks run once per poll — connections saturation, blocked sessions, long-running queries, buffer cache hit ratio, page life expectancy, memory grants pending, deadlocks, disk free, backup freshness, Always On health, failed Agent jobs, CPU usage, suspect pages, oldest open transaction, top waits, TempDB files, and autogrowth events. Selected databases add per-database rows: state, log space and log-reuse wait, log-backup freshness, CHECKDB freshness, VLF count, and data-file headroom.
- Counter-based checks (deadlocks, autogrowth, waits) are deltas between polls — real rates, not lifetime totals.
- Checks whose DMV the login can’t read degrade to “n/a” with the reason, never a failed source.
Custom T-SQL
Pick a target database (or the default master) and write any single-value SELECT — SELECT COUNT(*) FROM orders WHERE status = ’pending’. An optional Validate response assertion (>, <, =, ≠…) turns the card into a pass/fail check on top of the chart.
- SELECT only — write keywords and
xp_/sp_procedures are rejected, andTOP 1is added automatically when missing. - Custom queries run at
READ UNCOMMITTED, so monitoring never takes locks against production work.
4 · Query tracking — end to end
From a slow trace to the statement and back
Query tracking joins the statements SQL Server keeps (Query Store, or the plan cache as a fallback) with the statements your services put on their trace spans. Both are normalised to the same fingerprint — literals become ?, the (@p1 int, …) parameter declaration is stripped — so a database span can find its Query Store row and the statistics view shows what the application ran.
- Enable Query Store per database
ALTER DATABASE [db] SET QUERY_STORE = ON (OPERATION_MODE = READ_WRITE);and grant the login VIEW DATABASE STATE there. System databases cannot have Query Store — point the source at a user database. Without it Topologix readssys.dm_exec_query_stats(since the last restart / cache flush) and needs VIEW SERVER STATE. - Put the statement on the spanOpenTelemetry’s SQL Client instrumentation records command text only when asked: .NET
AddSqlClientInstrumentation(o => o.SetDbStatementForText = true); JDBC (Java agent) and@opentelemetry/instrumentation-tedious(Node.js) record it by default; Pythonpyodbc/sqlalchemyonce instrumented. The span needsdb.system=mssql,db.name, the server address anddb.statement. - Send the traces where Topologix reads spansOTLP ingest (direct), Zipkin, or Dynatrace with a platform token. SigNoz and Elastic APM sources give the service graph but not span text — pair them with one of the three if you want trace → statement.
- Link the trace source to this databaseOn the trace metric source, Database for statement stats → this integration (+ database). Host + database matching from the span works without it; the link is for hosts that differ (listener names, proxies, NAT).
- Verify both directionsHealth card → Statements (a note tells you when it fell back to the plan cache); trace → database span → DB stats. Trace-id search is opt-in and only meaningful with Query Store — a unique comment per request creates a plan-cache entry per request.
Server side — per monitored database
ALTER DATABASE [shop] SET QUERY_STORE = ON (OPERATION_MODE = READ_WRITE);
USE [shop];
GRANT VIEW DATABASE STATE TO [monitoring_ro];
Good to know
- Replication (DB-3). On an Always On member the suite reads one joined statement over
sys.availability_replicas,sys.dm_hadr_availability_replica_statesandsys.dm_hadr_database_replica_states: each replica’s role, connection and synchronization state, log-send and redo queues, and — on SQL Server 2016 and later — secondary lag seconds (older versions report the queues only). Seen from the primary the secondaries are listed with their lag and queues; seen from a secondary the section names the primary and shows the local redo queue.VIEW SERVER STATE, already required, covers all of it; the Always On check now charts the worst secondary lag with an editable 30 s threshold. On the Databases page every source gains a Replication section on both ends of a link: the primary lists each standby with its lag and what it retains for it, the replica shows the server it replicates from and how far behind it is. Replicas are paired automatically from what the engines report about each other (exact IP, then DNS name, then name) and can be pinned or switched off per source; a replica’s numbers are read from its own source’s stored results, so no credential ever travels between servers. Amber follows the source’s own warn thresholds; red is a categorical failure (a disconnected standby, a stopped thread) or five to ten times the warn level. Proxy agents older than 1.151.0 do not report replication and the section says so rather than reading “standalone”. - One integration, many servers: the host is a per-source field (the iLO model), so adding the next instance is a new source, not a new integration.
- Statement statistics. The health card’s Statements button lists the database’s top statements — sortable by total time, calls or mean, searchable, each row expanding to the full normalised statement with a Copy button for its fingerprint — read from Query Store when it is on, otherwise from
sys.dm_exec_query_statswith a note saying so and naming theALTER DATABASEthat fixes it. Literals are replaced by?first, and the parameter declaration Query Store prefixes to parameterised text ((@p1 int, @p2 nvarchar(50))) is dropped, so the same statement matches whether it arrived from a span or from the engine. - Searching statements by trace id is deliberately opt-in: it only works where per-execution text is kept (Query Store), and tagging every request with a unique comment gives SQL Server a separate plan-cache entry per request. The default correlation — from a database span in the trace viewer, through the DB stats lookup, to this integration — is by statement fingerprint, with Database for statement stats on the trace metric source naming the instance explicitly.
More Data & Storage integrations
See it on your own infrastructure
Book a demo and we will walk you through Topologix with your systems in mind: on our cloud, or self-hosted in your own network.