Oracle Database monitoring with Topologix
Data & Storage
Oracle health over the thin driver — no Oracle client install — with a check suite covering tablespaces, sessions, waits, RMAN backups, Data Guard, the recovery area, and invalid objects, plus 17 presets against the v$/dba_ views. Works with 19c+ including 23ai/26ai Free.
Requirements
- A monitoring user with
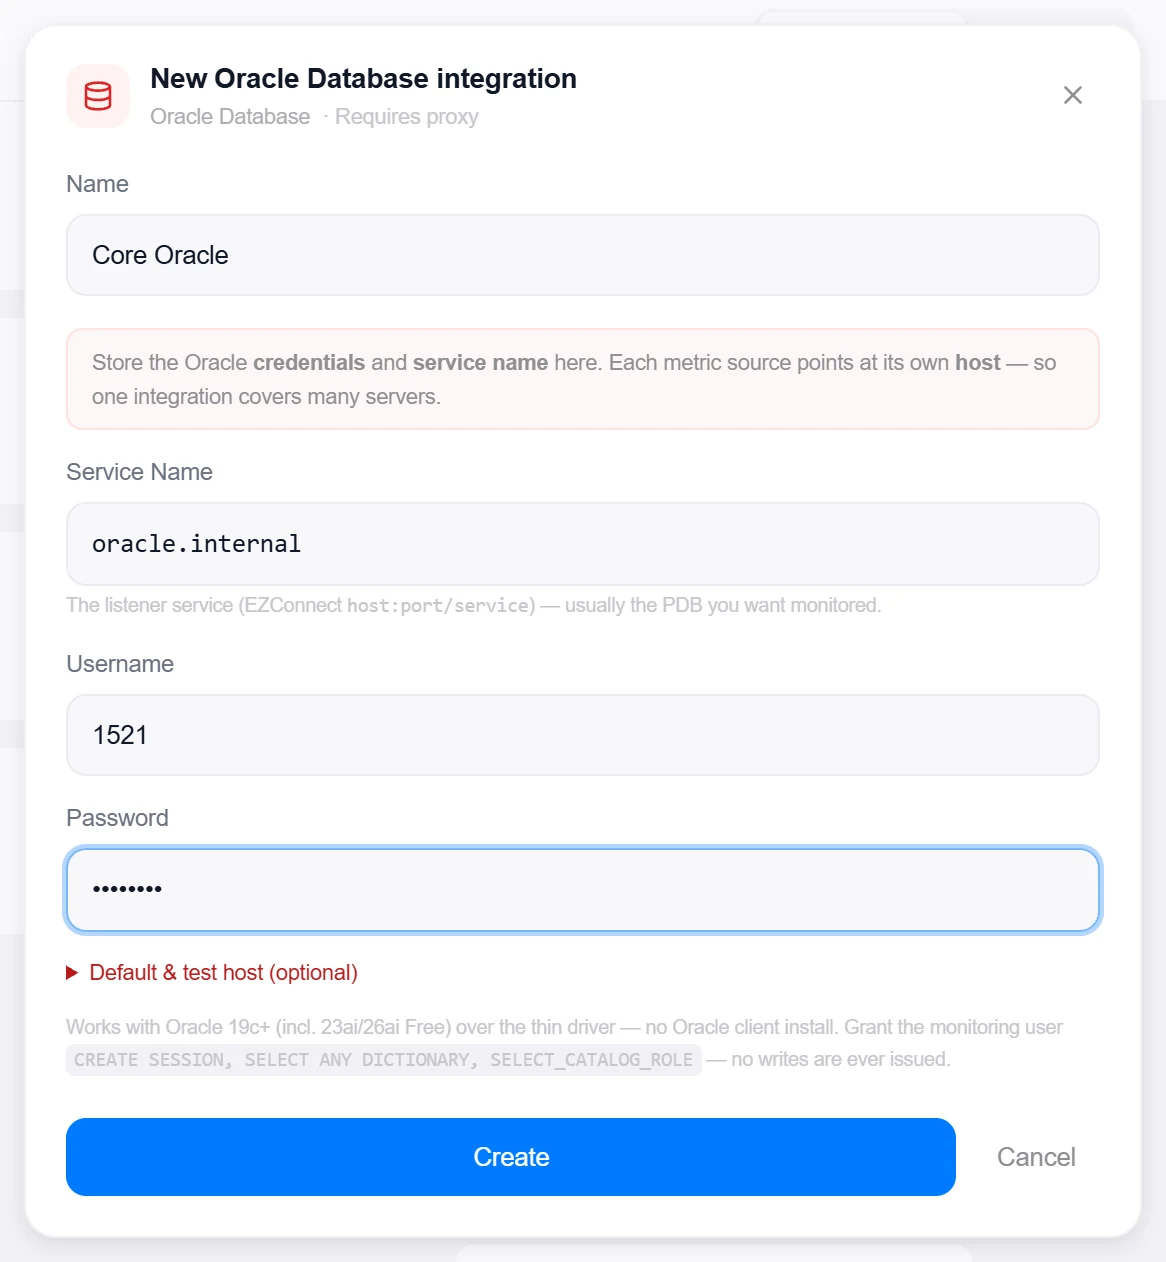
CREATE SESSION, SELECT ANY DICTIONARY, SELECT_CATALOG_ROLE— no writes are ever issued. - Network reach from the Topologix server or a proxy agent to the listener (default 1521), addressing the service by EZConnect (
host:port/service).
1 · Set up the integration
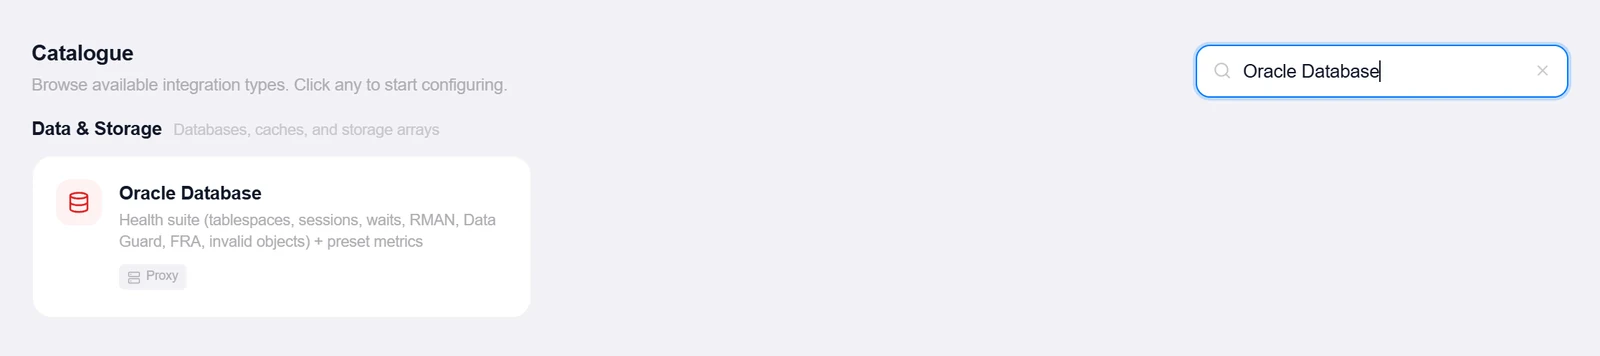
- Open the Integrations pageClick Integrations in the toolbar and pick Oracle Database from the catalogue.
- Enter service name and credentialsThe listener Service Name (usually the PDB you want monitored, e.g.
FREEPDB1) plus Username and Password. Hosts live on the metric sources; an optional Default & test host sets the fallback. - Create, then verifyClick Create, then reopen the integration and click Test — it reads the
v$versionbanner and reports exactly which release answered. Failures map ORA codes to plain language (locked account, unknown service, no listener…).
2 · Add it to a flow
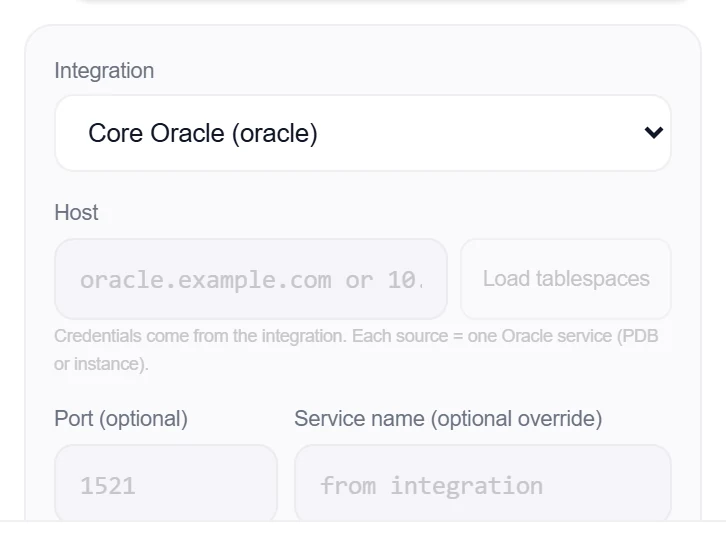
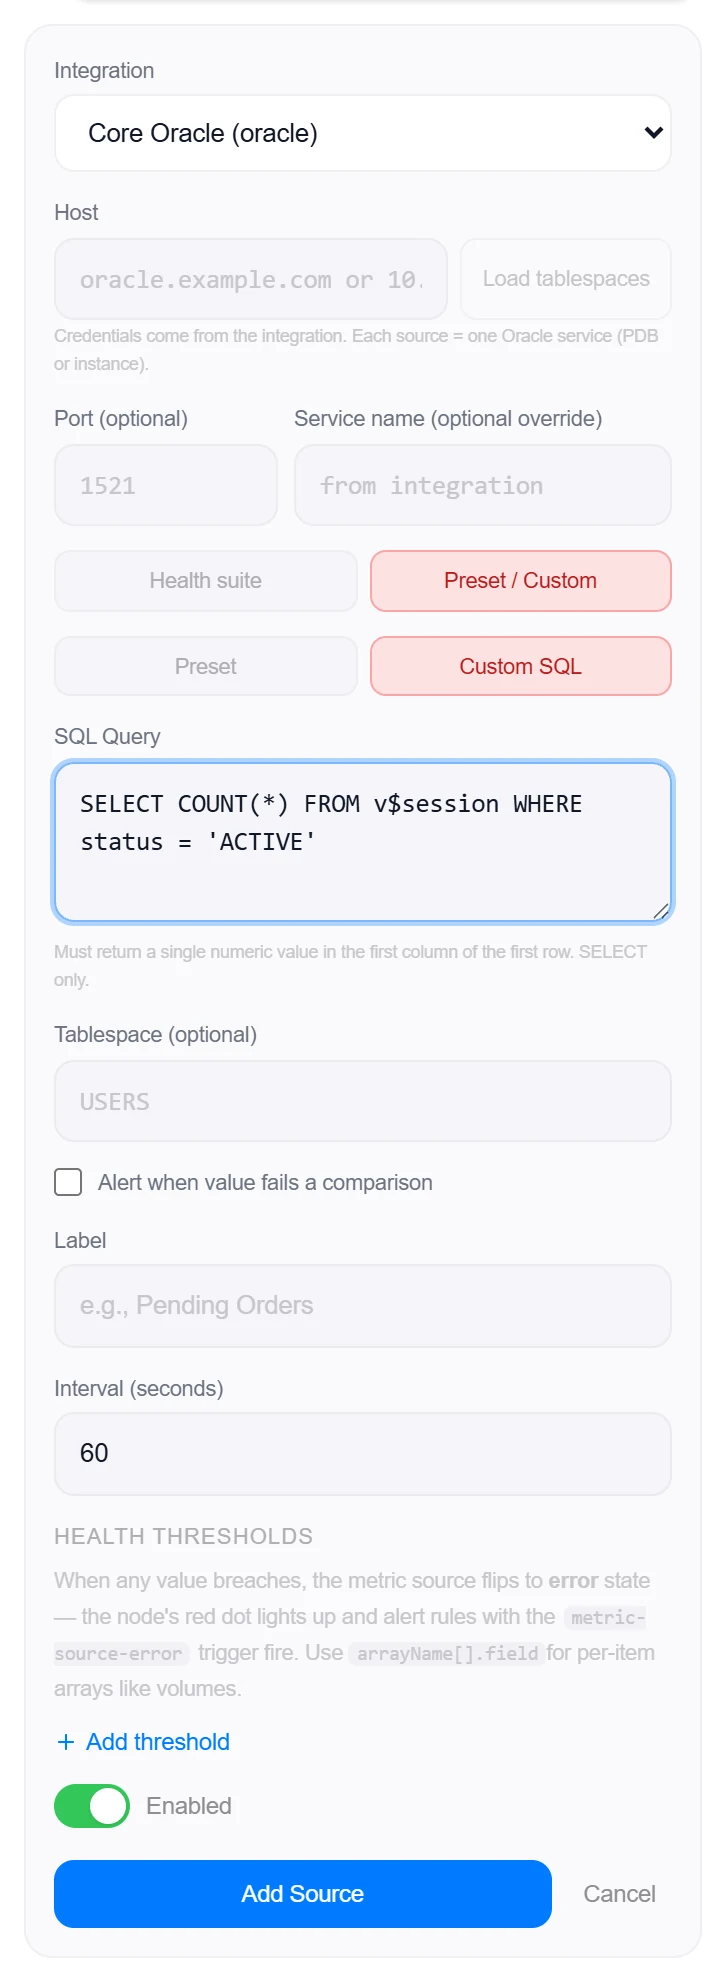
- Select the database nodeClick the node, open Metrics, then + Add and choose the Oracle integration. Enter the Host (each source = one Oracle service) — Load tablespaces discovers the non-temp tablespaces for the picker.
- Pick a modeTwo tabs: Health suite (the default) runs the full check suite; Preset / Custom charts one number — a preset or your own SQL.
- SaveIn health mode, optionally tick tablespaces to get per-tablespace usage rows (instance checks run once). Set the interval and click Add Source.
3 · Beyond presets: custom queries & the All-Services alarm
Health suite
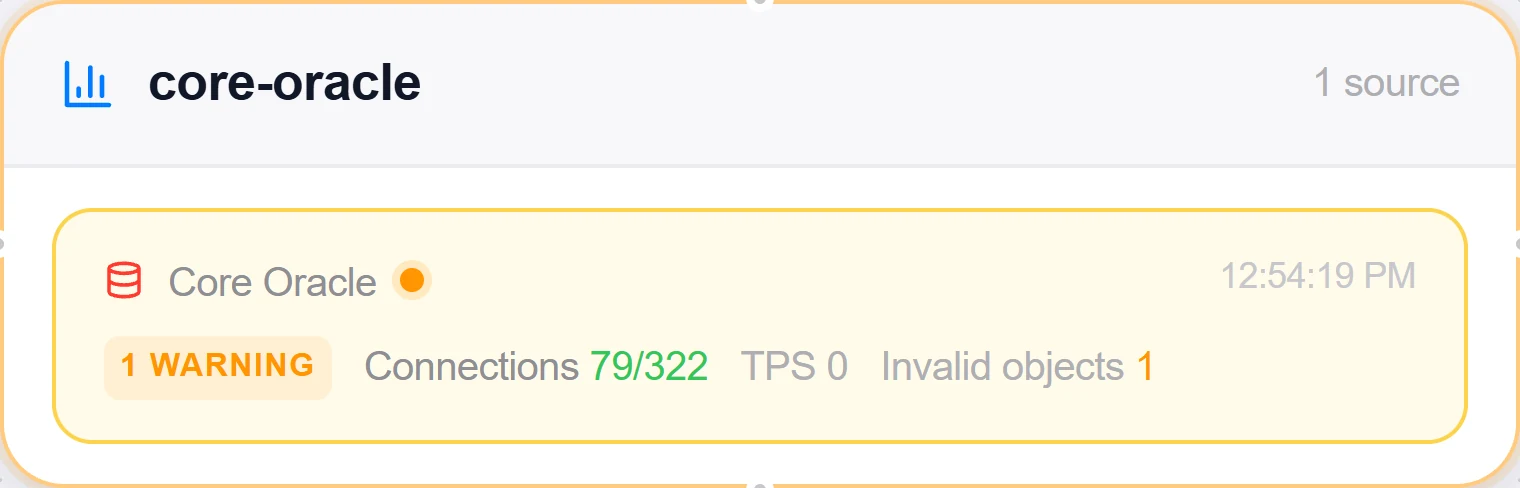
Tablespace usage against autoextend headroom, sessions and processes saturation, blocked and long-running sessions, the wait profile, rollback ratio, RMAN backup freshness, Data Guard lag, recovery area usage, invalid objects, and PDB state — rolled up to one card with pass/fail chips.
- Features the instance doesn’t run degrade to “n/a”, never a false alarm — on Oracle Free, RMAN backup, Data Guard, and the recovery area all read “n/a” by design.
- Tablespace usage is measured against the autoextend maximum, so a small datafile with room to grow doesn’t page you.
Custom SQL
Inside the Preset / Custom tab, a nested toggle picks Preset or Custom SQL. Custom queries must return a single numeric value in the first column of the first row — any business number living in Oracle becomes a canvas metric.
- SELECT only — DML/DDL/PLSQL keywords are rejected and multi-statement queries are blocked; a row cap is applied automatically when the query has no
FETCH FIRST/ROWNUMlimit.
Good to know
- Replication (DB-3). The role comes from
v$database; a standby reports Data Guard apply and transport lag fromv$dataguard_stats(an unmeasured lag stays unknown, never 0), and a primary lists its standby destinations fromv$archive_dest_statuswith any gap or error — the primary cannot measure apply lag, so that figure fills in only when the standby is itself monitored. No grants beyondSELECT ANY DICTIONARY. On the Databases page every source gains a Replication section on both ends of a link: the primary lists each standby with its lag and what it retains for it, the replica shows the server it replicates from and how far behind it is. Replicas are paired automatically from what the engines report about each other (exact IP, then DNS name, then name) and can be pinned or switched off per source; a replica’s numbers are read from its own source’s stored results, so no credential ever travels between servers. Amber follows the source’s own warn thresholds; red is a categorical failure (a disconnected standby, a stopped thread) or five to ten times the warn level. Proxy agents older than 1.151.0 do not report replication and the section says so rather than reading “standalone”. - The connection uses the thin driver — nothing to install on the Topologix server, and connections are pooled and evicted after idle.
- “Databases” for Oracle are tablespaces: the health card’s per-item rows and the per-tablespace preset both bind a tablespace name.
More Data & Storage integrations
See it on your own infrastructure
Book a demo and we will walk you through Topologix with your systems in mind: on our cloud, or self-hosted in your own network.