SAP HANA monitoring with Topologix
Data & Storage
SAP HANA health without Solution Manager — memory and CPU per service, connections, blocked transactions, savepoints, delta merges, column unloads, backups, system replication, licence expiry and HANA's own alert catalogue — plus 35 presets over the M_* monitoring views. One integration holds the credentials; each metric source points at its own host, so one integration covers the landscape.
Requirements
- A monitoring user with
GRANT MONITORING TO <user>— read-only access to the system views and the statistics server’s alerts. (The narrower alternative isCATALOG READplusSELECT ON _SYS_STATISTICS.STATISTICS_CURRENT_ALERTS.) No writes are ever issued. - Network reach from the Topologix server or a proxy agent to the SQL port —
3<nn>13for SYSTEMDB,3<nn>15for the first tenant of a single-container system,3<nn>41+ for later tenants (nn= instance number). HANA Express answers on 39017 (SYSTEMDB) and 39041 (tenant HXE). - HANA Cloud is reachable on port
443and always requires TLS — the driver switches it on automatically for 443, and the Use TLS toggle plus an optional CA cover on-premise TLS. - Give the user a password with
DISABLE PASSWORD LIFETIME, or the login stops working 182 days later — the default policy expires monitoring accounts too. - Statement statistics (optional):
MONITORINGalready coversM_SQL_PLAN_CACHE, so the aggregated per-statement figures need no extra grant. Per-execution rows (M_EXPENSIVE_STATEMENTS) need the expensive-statement trace switched on:ALTER SYSTEM ALTER CONFIGURATION ('global.ini','SYSTEM') SET ('expensive_statement','enable') = 'true', ('expensive_statement','threshold_duration') = '<microseconds>' WITH RECONFIGURE— on a multi-tenant system the SYSTEM layer is written from SYSTEMDB, or use theDATABASElayer to keep it tenant-local.
1 · Set up the integration
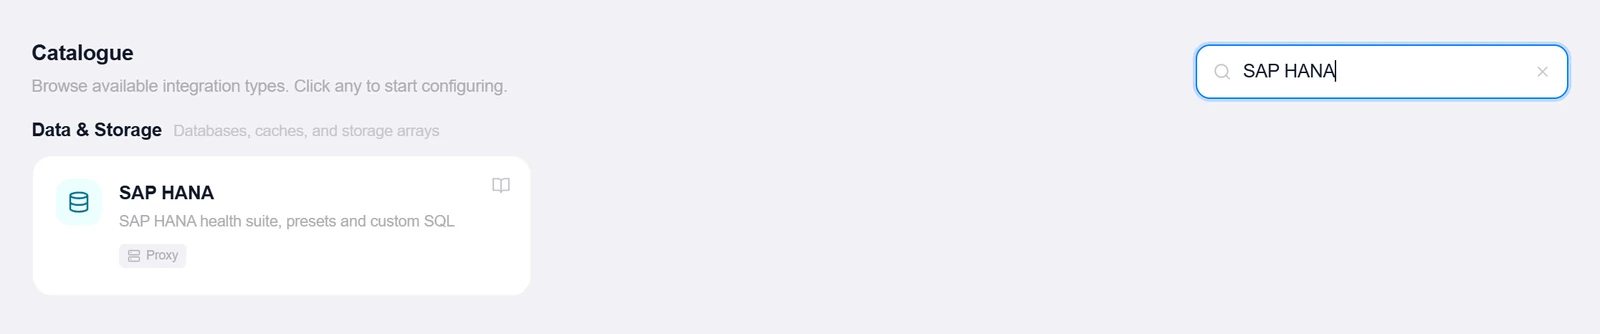
- Open the Integrations pageClick Integrations in the toolbar and pick SAP HANA from the catalogue.
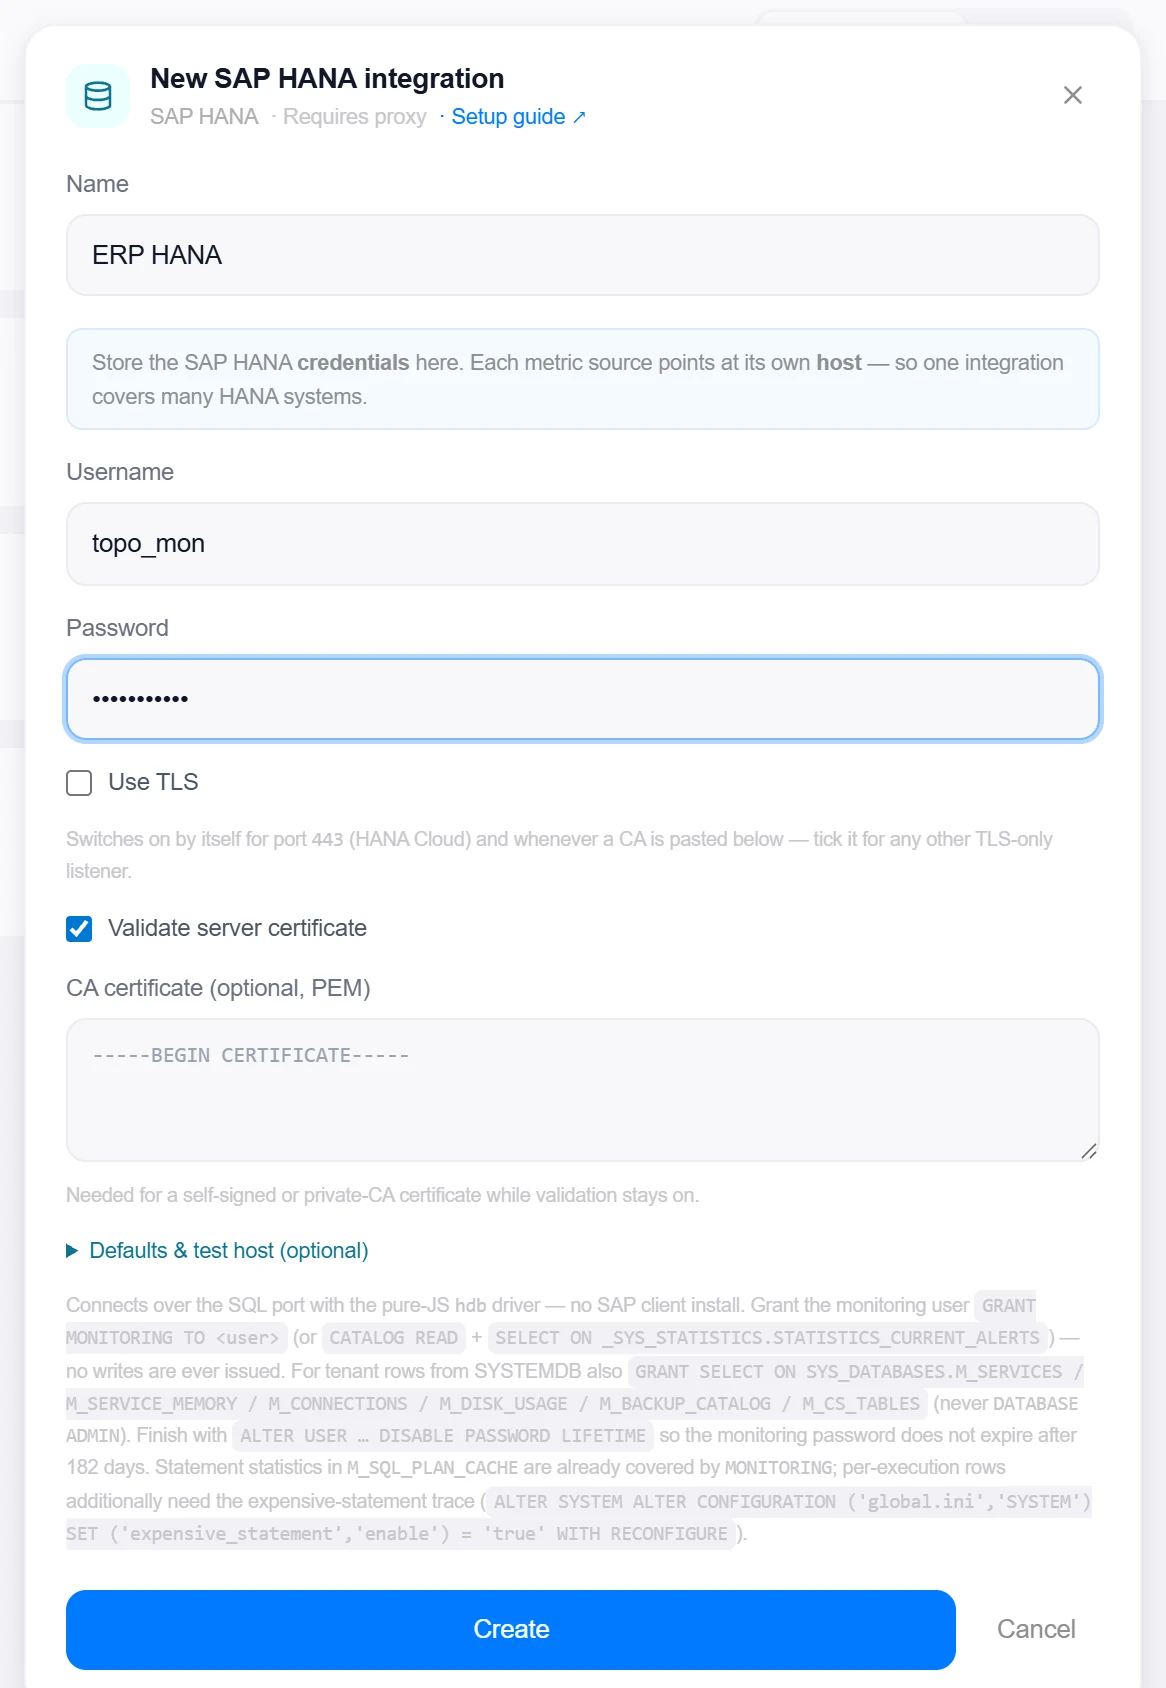
- Enter the credentialsJust Username and Password — the host lives on each metric source, so one integration covers the whole landscape. Use TLS (which switches on by itself for port
443and whenever a CA is pasted) plus Validate server certificate and an optional PEM cover TLS listeners. - Optionally set a fallback hostThe Defaults & test host section holds a default host, port and tenant database — the target the Test button uses. It carries the port cheat-sheet:
3<nn>13SYSTEMDB,3<nn>15/3<nn>41+ tenant,39017/39041(SYSTEMDB/tenant) on HANA Express,443HANA Cloud. - Create, then verifyClick Create, then reopen the integration and click Test — it reports the database name, the HANA version, and whether the rows will be tenants or schemas. Failures map HANA error codes to plain language (authentication failed, insufficient privilege with the exact GRANT, unknown tenant, wrong port).
2 · Add it to a flow
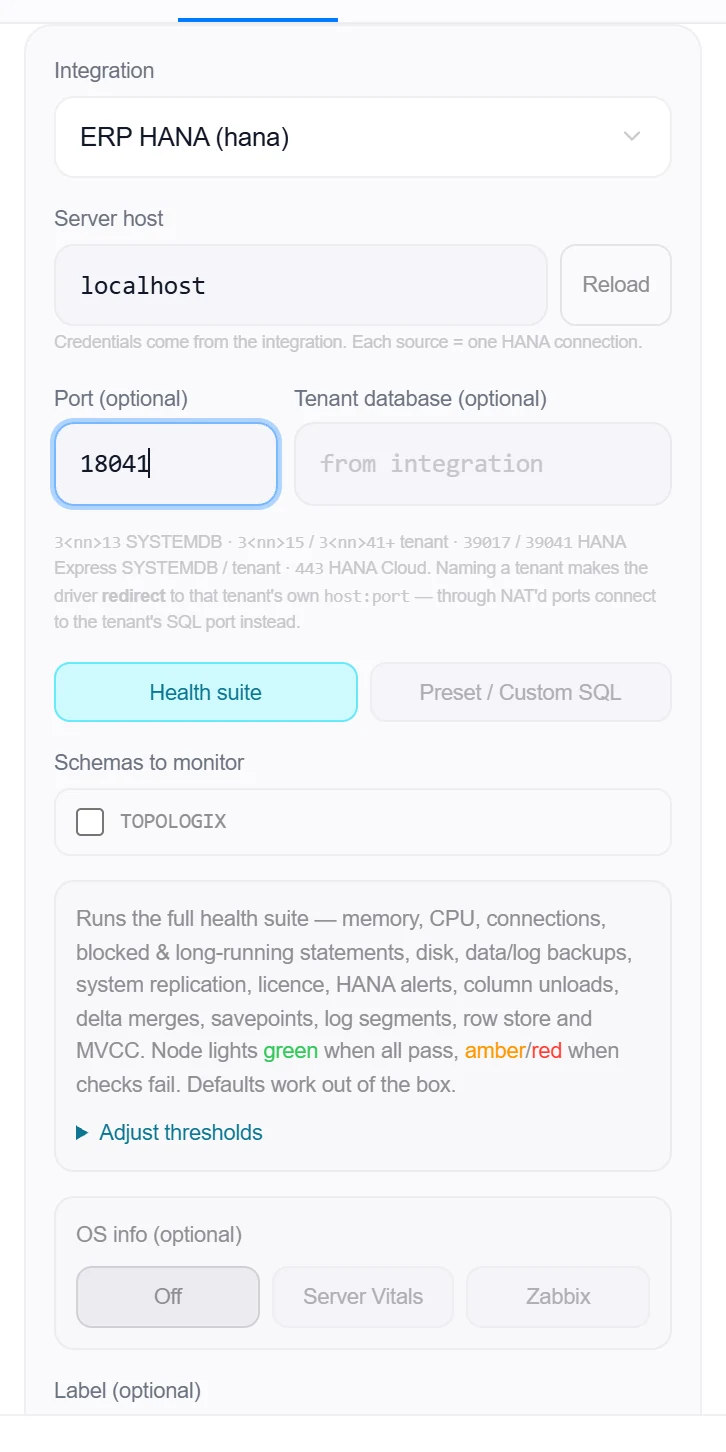
- Select the database nodeClick the node, open Metrics, then + Add and choose the SAP HANA integration. Enter the Host (each source = one HANA system) — Load databases discovers tenants or schemas, whichever this connection can see.
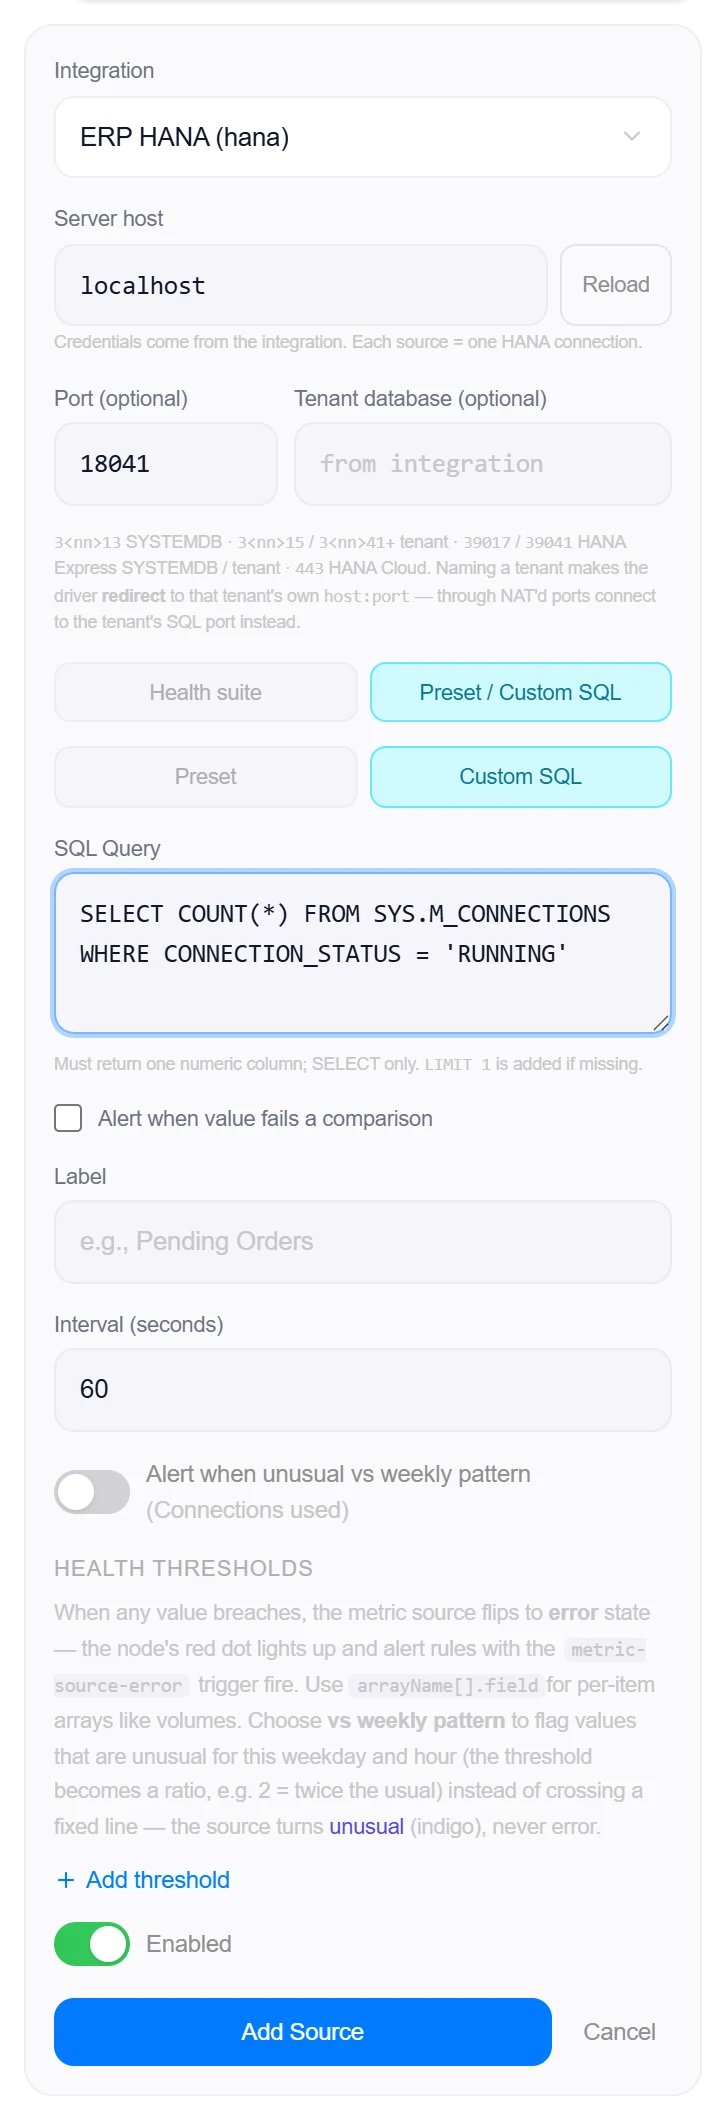
- Pick a modeTwo tabs: Health suite (the default) runs the full check suite; Preset / Custom charts one number — a preset or your own SQL.
- SaveIn health mode, optionally tick tenants (on SYSTEMDB) or schemas (on a tenant) to get per-row checks; instance checks run once regardless. Set the interval and click Add Source.
3 · Beyond presets: custom queries & the All-Services alarm
Health suite
Instance checks run once per poll, grouped on the card into sections (availability, memory & CPU, sessions & threads, statements, locks, disk & persistence, column store, replication, backups, diagnostics, licence) — a section with nothing failing folds to one line. They cover services and hosts, memory used vs the allocation limit (with the per-service breakdown), CPU, sessions by state with the top users, idle-in-transaction sessions, admission-control pressure, SQL-executor and job-executor pools, blocked transactions, lock waits grouped by object with the transaction holding the lock, the lock-wait rate and lock timeouts, long-running statements, the oldest open transaction, the data and the log volume separately, the row/column-store split, the instance-wide delta backlog with the tables carrying it (and any with auto merge off), the column load state, savepoint duration and frequency, the log-segment backlog, row-store fragmentation, MVCC versions, data- and log-backup freshness, the widest gap between log backups, a broken backup history, the last backup’s duration and size, system replication (shipping and replay lag, secondary state, failovers), licence expiry and usage, OOM events and dump files, trace-file size and growth, the latest table consistency check, and HANA’s own STATISTICS_CURRENT_ALERTS. Selected rows add per-row checks on top.
- CPU and commits/sec are deltas between polls against HANA’s cumulative counters, so the first tick after a restart reads
n/arather than a fabricated spike. - A view the login cannot read, or a feature this system does not run (no replication,
log_mode = overwrite, no data backup yet), degrades to “n/a” with the reason — never a failed source and never a false page. - Checks that scan the column store or the trace (delta backlog, store split, column load state, lock timeouts, backup history, dumps, trace files, consistency) recompute at most every 5 minutes and say “checked N m ago” in between; statement latency (p50/p95/p99) and the 24-hour expensive statements count are opt-in and need the expensive-statement trace. A monitoring poll never becomes the load.
- The raw numbers behind the checks (memory and volume bytes, sessions by state, lock-wait rate, replication lag, executor pools, the biggest tables’ memory and record counts…) are kept as history, so every one of them charts and can carry an alert.
Presets & custom SQL
Inside the Preset / Custom tab, a nested toggle picks Preset or Custom SQL. The 35 presets cover connections, throughput, efficiency, memory, storage and availability; the ones that bind a name (schema memory, tenant memory, tenant connections…) are filtered to the rows this connection can actually see. Custom queries must return a single numeric value in the first column of the first row.
- SELECT only — DML/DDL and HANA-specific verbs (
UPSERT,MERGE,IMPORT/EXPORT,BACKUP,SET…) are rejected, multi-statement queries are blocked, andLIMIT 1is appended when the query has no limit of its own. - An optional Validate response assertion (>, <, =, ≠…) turns the card into a pass/fail check on top of the chart.
Diagnose — the Databases page
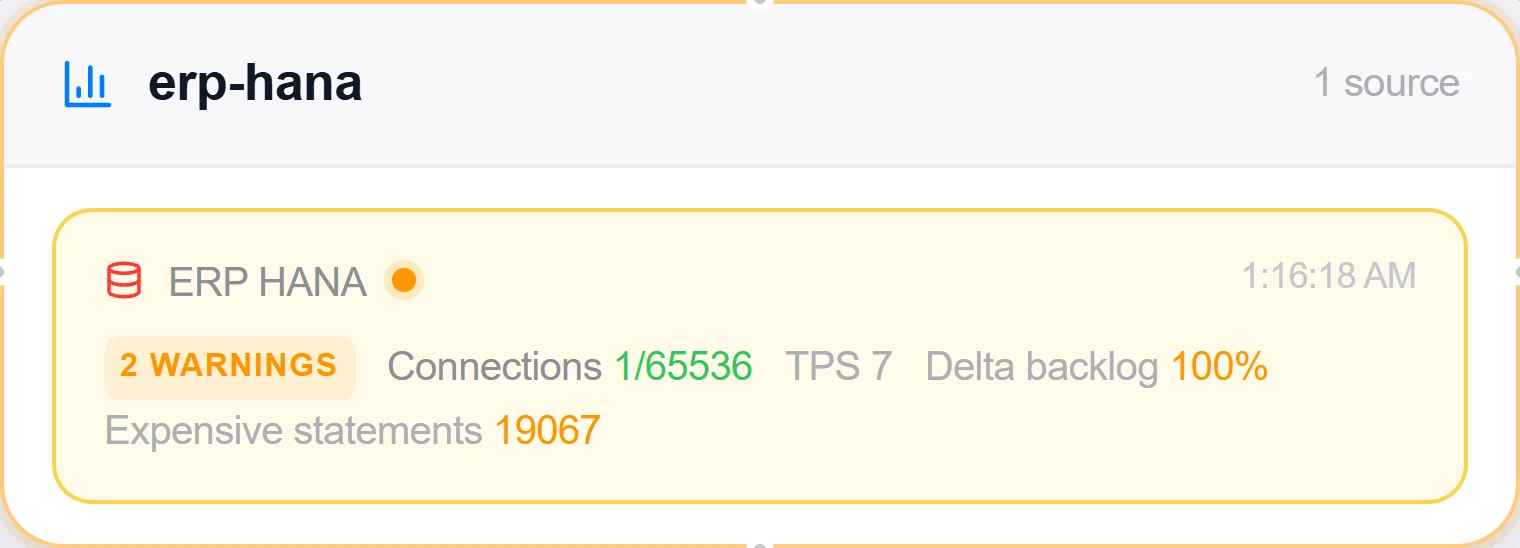
Infrastructure → Databases opens a landscape of every database you can see — one tile per health-suite source, and one per tenant for a SYSTEMDB source — sorted so whatever needs attention comes first, each with memory, CPU, sessions and blocked transactions and up to three reasons it is amber or red. Clicking a tile (or Diagnose on the HANA card) opens that system: memory against the allocation limit, data and log volumes against their size, sessions by state, and replication lag over 24 h to 90 days, followed by the grouped checks and the ways into Statements and the full history.
- When memory or a volume grows steadily, the chart projects the trend as a dashed line and names the ETA (“allocation limit in ~5 d at this rate”). A flat, noisy or too-short run never gets an ETA.
- Deep link:
?view=databases&system=<integration id>opens straight on one system.
Investigate — what ran, what grew, who holds the lock
Click any point on a Databases chart (or on the full history of a HANA source) and the Statements dialog opens on that moment: the statements that were running in the bucket, per execution, from the expensive-statement trace — with the 95th-percentile duration, time spent waiting for locks and executions that gave up on a lock (error 131). Widen doubles the window; the cross closes it back to the cumulative plan cache. Table growth lists the biggest column tables with how much each grew over 24 h or 7 days (from Topologix’s own history for the tables it tracks, else from HANA’s statistics server), the rows still in delta and the last merge. Lock waits shows every object someone is waiting on, the waiting sessions with their statement, and the transaction holding the lock — its user, application and lock mode — refreshed every 15 s; Find statement jumps to the waiting statement’s statistics.
- Time windows need the expensive-statement trace (see the requirements); with it off the dialog says so and hands you the ALTER SYSTEM that enables it. The monitor’s own queries are always left out.
- Table growth, lock waits and windowed statements need a proxy of version 1.133.0 or later when the source is polled through a proxy — an older one gets a clear “update the proxy” message.
Details & Statements
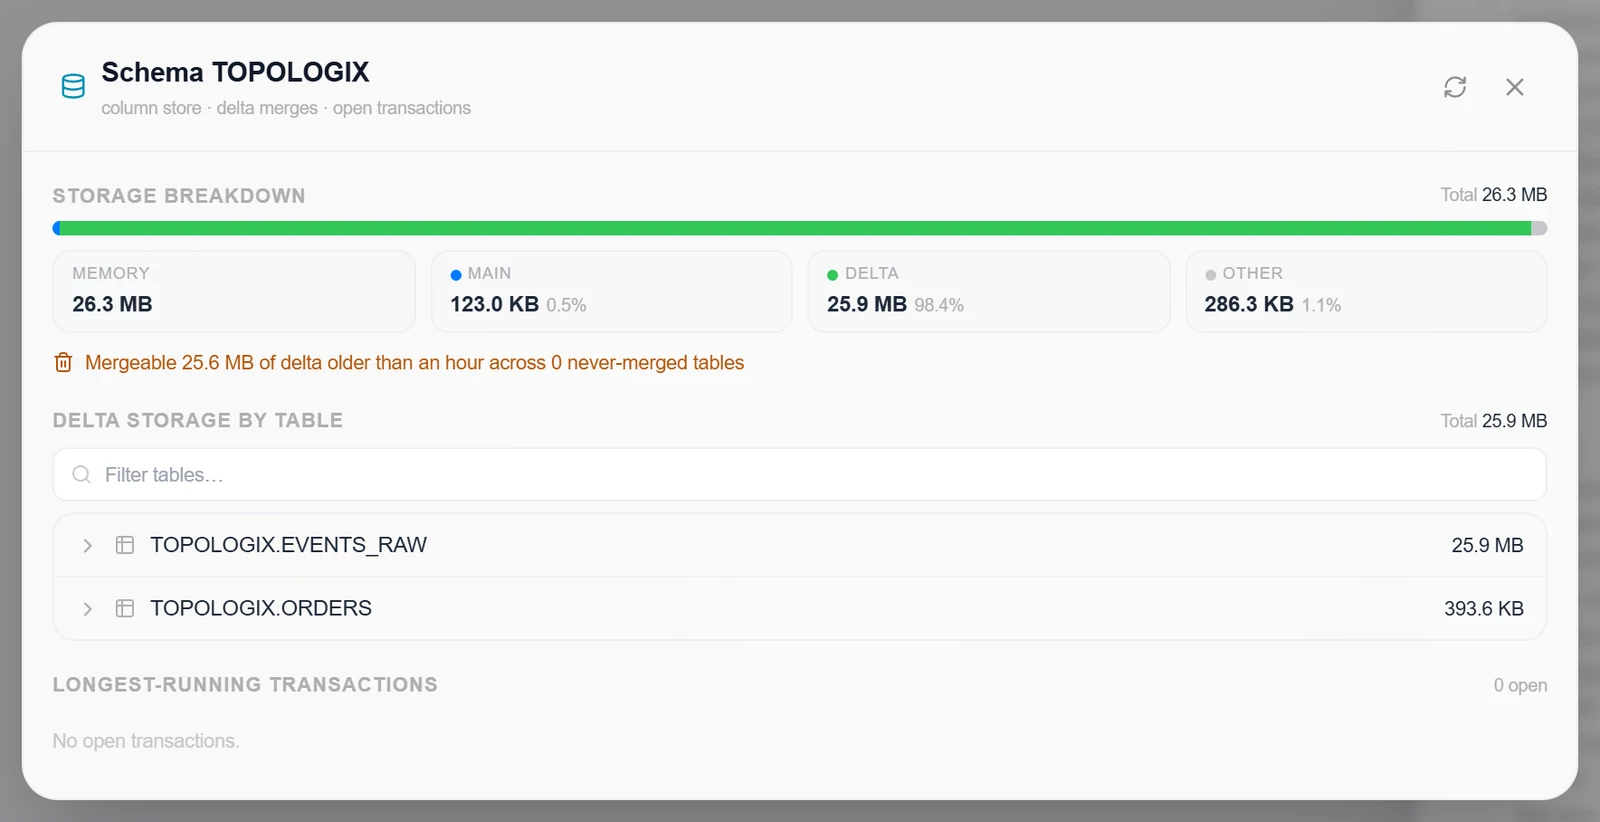
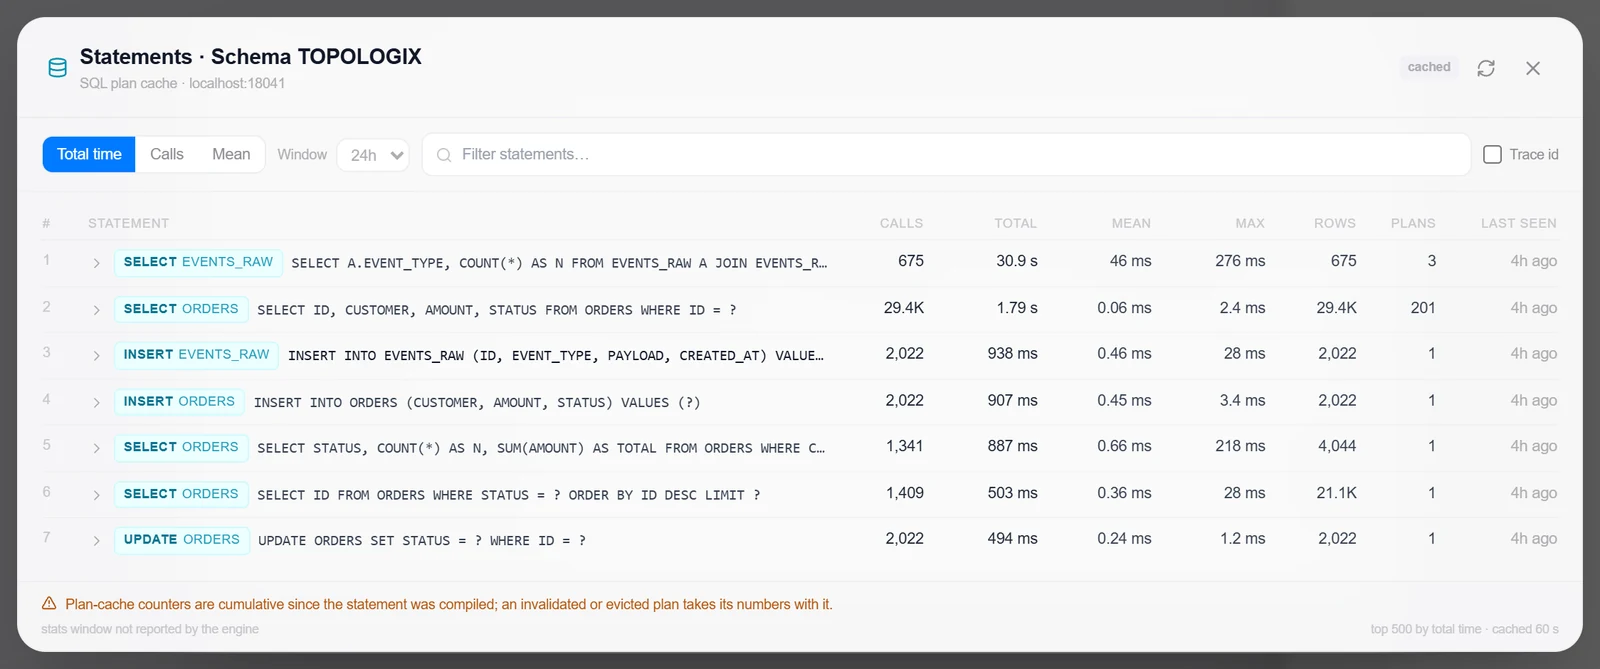
Each per-row entry on the health card (a schema on a tenant connection, a tenant on SYSTEMDB) carries two buttons. Details opens the column-store drill-down: the biggest tables by in-memory size with their delta share and time since the last merge, the memory split (main / delta / other), how much delta a merge would fold away, and the open transactions touching the schema. Statements opens the plan-cache view: the schema’s top statements by total time, calls or mean, each row expanding to the normalised text and its fingerprint.
- Both dialogs are read on demand — nothing is stored — and go through the same proxy node as the source, so a HANA behind a proxy agent works unchanged.
- On a SYSTEMDB connection the tenant row’s Details shows the tenant’s memory footprint only: HANA keeps no cross-tenant copy of the table, transaction or plan-cache views, so point a second source at the tenant’s own SQL port for those.
4 · Query tracking — end to end
From a slow trace to the statement and back
Query tracking joins HANA’s plan cache (M_SQL_PLAN_CACHE, aggregated per statement) with the statements your services put on their trace spans. Both are normalised to the same fingerprint — literals become ?, HANA’s upper-cased identifiers are canonicalised — so a database span can find its plan-cache row and the statistics view shows what the application ran.
- Grant and, optionally, trace
GRANT MONITORING TO topo_monalready covers the plan cache. For per-execution rows (needed only for trace-id search) switch the expensive-statement trace on:ALTER SYSTEM ALTER CONFIGURATION ('global.ini','SYSTEM') SET ('expensive_statement','enable') = 'true', ('expensive_statement','threshold_duration') = '<µs>' WITH RECONFIGURE— from SYSTEMDB on a multi-tenant system, or with theDATABASElayer to keep it tenant-local. - Put the statement on the spanSAP’s own drivers are instrumented through OpenTelemetry’s generic layers: JDBC (Java agent,
ngdbcdriver) by default, PythonhdbclithroughSQLAlchemyInstrumentorwith thesqlalchemy-hanadialect, Node.js@sap/hana-clientvia a manual span around each execute. The span needsdb.system=hanadb(orsap.hana),db.name= the tenant, the server address anddb.statement. - Send the traces where Topologix reads spansOTLP ingest (direct), Zipkin, or Dynatrace with a platform token. SigNoz and Elastic APM sources give the service graph but not span text.
- Link the trace source to this databaseOn the trace metric source, Database for statement stats → this integration; on the HANA side the row is a schema (tenant connection) or a tenant (SYSTEMDB connection). Host matching from the span also works when the tenant’s SQL port is what the span names.
- Verify both directionsHealth card → Statements reads
M_SQL_PLAN_CACHEfor the schema; trace → database span → DB stats returns the matching plan-cache row. Do not tag statements with a per-request comment — every variant becomes its own plan-cache entry; if you want the trace id on the database side, set theAPPLICATIONSOURCEsession variable instead (it lands inM_EXPENSIVE_STATEMENTS.SESSION_VARIABLES, which trace-id search reads).
Server side — grant, plus the optional per-execution trace
GRANT MONITORING TO topo_mon;
-- optional, only for searching statements by trace id
ALTER SYSTEM ALTER CONFIGURATION ('global.ini','SYSTEM')
  SET ('expensive_statement','enable') = 'true',
      ('expensive_statement','threshold_duration') = '1000000'   -- microseconds
  WITH RECONFIGURE;
Good to know
- Replication (DB-3). System replication channels from
M_SERVICE_REPLICATIONare rolled up per secondary site — status, shipping and replay delay, backlog bytes — into the same Replication section the other engines use; a secondary site is recognised as a replica. No new SQL and no new grants. On the Databases page every source gains a Replication section on both ends of a link: the primary lists each standby with its lag and what it retains for it, the replica shows the server it replicates from and how far behind it is. Replicas are paired automatically from what the engines report about each other (exact IP, then DNS name, then name) and can be pinned or switched off per source; a replica’s numbers are read from its own source’s stored results, so no credential ever travels between servers. Amber follows the source’s own warn thresholds; red is a categorical failure (a disconnected standby, a stopped thread) or five to ten times the warn level. Proxy agents older than 1.151.0 do not report replication and the section says so rather than reading “standalone”. - What the per-row list holds depends on where you connect: SYSTEMDB shows tenants (state, memory, backup freshness, connections, data size), a tenant shows schemas (delta backlog, failed merges, blocked transactions, unloads, column-store memory). The card relabels itself accordingly.
- Naming a Database makes the driver re-resolve that tenant and reconnect to the host and port the server reports — correct on a flat network, broken through NAT or a published container port. Behind port mapping, point the source straight at the tenant’s own port and leave Database empty.
- Clicking a row opens the drill-down: the biggest tables by column-store memory with their delta share and time since the last merge, on-disk size, and the transactions currently touching that schema or tenant.
- Statement statistics. The health card’s Statements button reads
M_SQL_PLAN_CACHE— the top statements by total time, calls or mean, searchable, each row expanding to the full normalised statement with a Copy button for its fingerprint. Literals are replaced by?before storage or display, and HANA's uppercase identifiers are folded away before hashing, so a statement matches whether it arrived from a database span or from the plan cache. With the expensive-statement trace on, the same dialog can additionally show per-execution rows fromM_EXPENSIVE_STATEMENTS; with it off the dialog says so and prints theALTER SYSTEMthat turns it on. - Correlating a trace with HANA: the DB stats lookup on a database span matches by statement fingerprint, and Database for statement stats on the trace metric source names this system explicitly. Do not tag statements with a per-request comment — every variant becomes its own plan-cache entry. If you want the trace id on the database side, have the client set
SESSIONVARIABLE:APPLICATIONSOURCE, which surfaces asAPPLICATION_SOURCEon the expensive-statement rows.
More Data & Storage integrations
See it on your own infrastructure
Book a demo and we will walk you through Topologix with your systems in mind: on our cloud, or self-hosted in your own network.