PostgreSQL monitoring with Topologix
Data & Storage
Monitor PostgreSQL with a zero-configuration health suite — connections, cache hit ratio, TPS, deadlocks, replication lag — or chart any of the 30 built-in presets across 8 categories.
Requirements
- A PostgreSQL role with
pg_monitor(or at least CONNECT + pg_stat views):CREATE ROLE monitoring_ro LOGIN PASSWORD ’…’; GRANT pg_monitor TO monitoring_ro; - Network reach from the Topologix server or a proxy agent to the database port (default 5432). TLS supported, including self-signed with the verification toggle.
- Statement statistics (optional): add
shared_preload_libraries = 'pg_stat_statements'topostgresql.confand restart the server (it is a shared library —CREATE EXTENSIONalone is not enough), then runCREATE EXTENSION pg_stat_statements;in any one database — its view covers every database on the instance, and Topologix looks for it across the instance when a source points at a database that does not have it (the error then names the databases it checked and the missing step). The role needspg_read_all_stats, whichpg_monitoralready carries; without it the view hides the text of everyone else's statements.
1 · Set up the integration
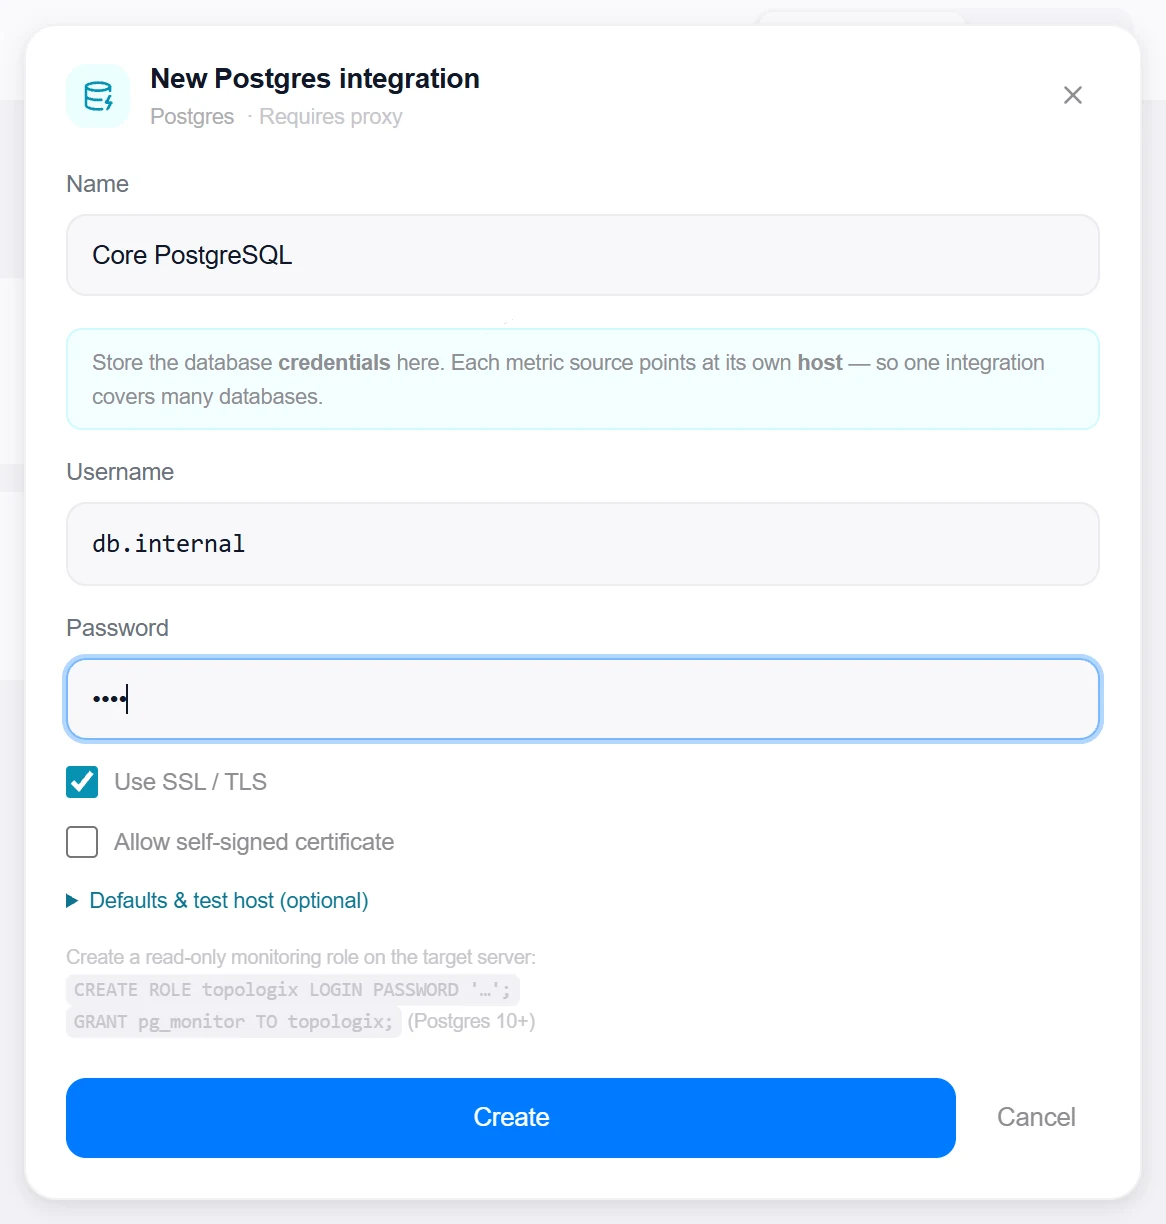
- Open the Integrations pageClick Integrations in the toolbar and pick Postgres from the catalogue.
- Enter connection detailsHost, port, database, and the monitoring role’s credentials. Credentials are encrypted at rest.
- Create, then verifyClick Create, then reopen the integration and click Test — it runs
SELECT 1plus a pg_stat probe and reports exactly what failed if anything did.

2 · Add it to a flow
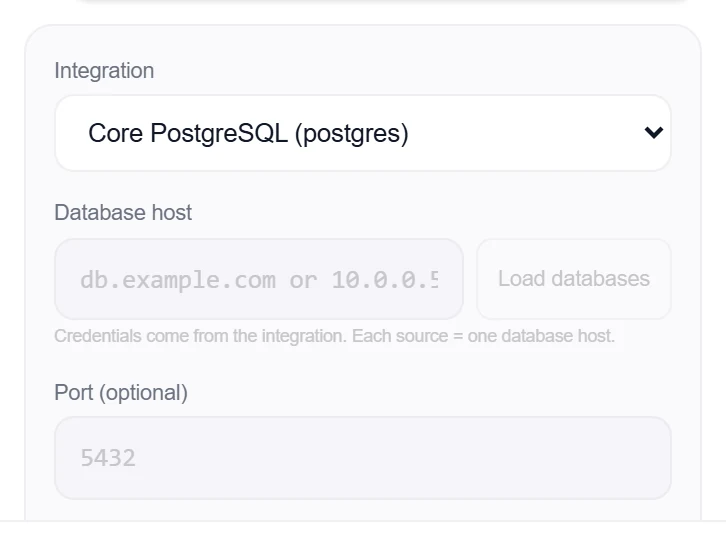
- Select the database nodeClick the node, open Metrics, then + Add and choose the Postgres integration.
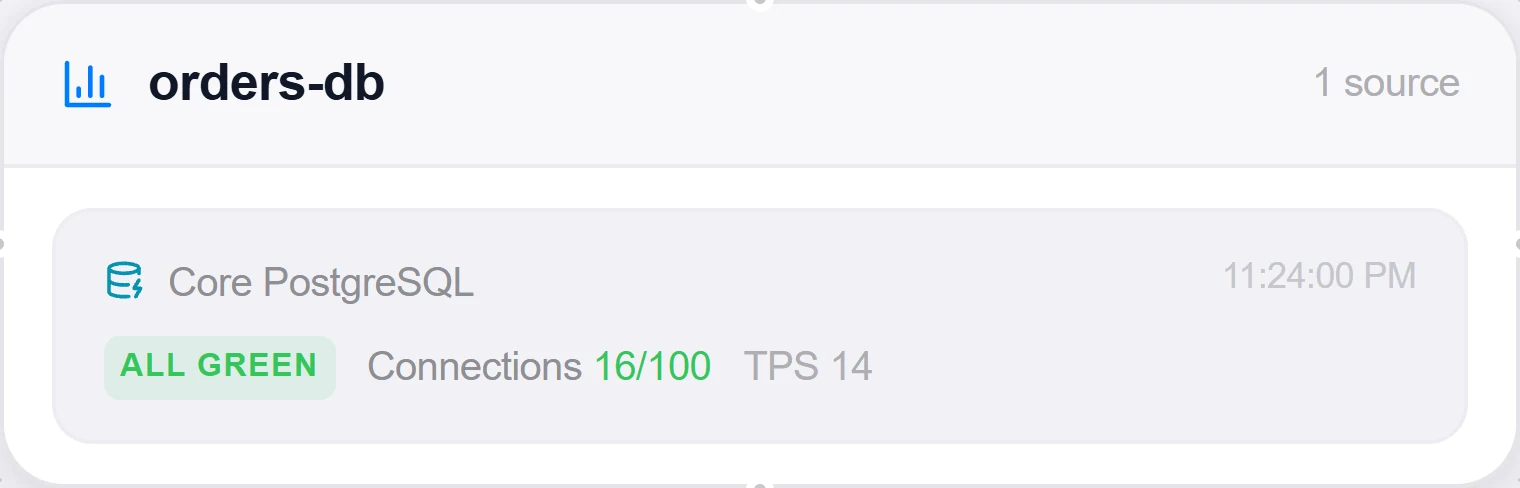
- Pick health suite or presetsThe Health mode runs the full check suite (connections, cache hit ratio, TPS, deadlocks, dead tuples, replication) and paints pass/fail chips on the card. Preset mode charts a single metric instead.
- SaveSet the interval and click Add Source. The card shows live values with a sparkline; health failures turn the node red.
4 · Query tracking — end to end
From a slow trace to the statement and back
Query tracking joins two sides: the statements PostgreSQL itself counts (pg_stat_statements) and the statements your services put on their trace spans. Both are normalised to the same fingerprint — literals replaced by ?, identifiers and whitespace canonicalised — so a database span in a trace can look up “its” row in the statistics, and the statistics view can show what the application actually ran.
- Enable statistics on the server
shared_preload_libraries = 'pg_stat_statements'inpostgresql.conf(or the RDS / Cloud SQL parameter group), restart, thenCREATE EXTENSION pg_stat_statements;in any one database — its view covers the whole instance and Topologix finds it wherever it was created. Grant the monitoring rolepg_monitorso it sees everyone’s statements, not just its own. - Put the statement on the spanOpenTelemetry does this per driver: JDBC (Java agent) and
@opentelemetry/instrumentation-pg(Node.js) by default; PythonPsycopgInstrumentor().instrument()/SQLAlchemyInstrumentor; .NETAddNpgsql()tracing; Gootelsql.Open("pgx", …). The span needsdb.system=postgresql,db.name, the server address anddb.statement— details under “Capture SQL on database spans” in the OpenTelemetry guide. - Send the traces where Topologix reads spansOTLP ingest (direct), Zipkin, or Dynatrace with a platform token. SigNoz and Elastic APM sources give you the service graph but not span text, so pair them with one of the three (an OpenTelemetry Collector with two exporters) if you want trace → statement.
- Link the trace source to this databaseOn the trace metric source, Database for statement stats → this integration (+ database). Topologix also matches by host and database name from the span, so the link is only required when the span’s host differs from the integration’s (proxy, NAT, DNS alias).
- Verify both directionsHealth card → Statements lists the top statements with calls / total / mean and a fingerprint per row. Open a trace, expand a database span → DB stats shows the same numbers for that statement. If the span says “pg_stat_statements is not set up”, the error names the databases it checked and the missing step.
Server side — once per instance
# postgresql.conf (needs a restart)
shared_preload_libraries = 'pg_stat_statements'
pg_stat_statements.track = all

-- in any one database
CREATE EXTENSION IF NOT EXISTS pg_stat_statements;
GRANT pg_monitor TO monitoring_ro;
Good to know
- Replication (DB-3). The suite reads every standby in
pg_stat_replication(state, sync state, write/flush/replay lag, bytes behind) and, on a standby, the WAL receiver — status, sender host and port, slot name, last replayed position and its timestamp, neverconninfo— pluspg_is_in_recovery()for the role. Each physical slot is joined to the standby using it, so a row shows the WAL retained for that standby; logical slots are listed as consumers (a Debezium connector, for example) with their retained bytes, and an inactive one that keeps retaining WAL becomes a verdict cause. Apply delay on a standby is zero only when the received and replayed positions agree; anything unmeasured stays unknown, never 0. A role withoutpg_monitorsees the standby rows with their details hidden — the section reports that as a permission gap, not as a healthy standby. On the Databases page every source gains a Replication section on both ends of a link: the primary lists each standby with its lag and what it retains for it, the replica shows the server it replicates from and how far behind it is. Replicas are paired automatically from what the engines report about each other (exact IP, then DNS name, then name) and can be pinned or switched off per source; a replica’s numbers are read from its own source’s stored results, so no credential ever travels between servers. Amber follows the source’s own warn thresholds; red is a categorical failure (a disconnected standby, a stopped thread) or five to ten times the warn level. Proxy agents older than 1.151.0 do not report replication and the section says so rather than reading “standalone”. - The health suite’s thresholds are editable per source; each check can also drive alert rules individually.
- Replication slots. Between the instance checks and the per-database blocks the card lists every slot in
pg_replication_slots— logical or physical, the database a logical slot decodes, whether it is active, and how much WAL it is holding — because an inactive slot retains WAL without bound until the data disk fills, and nothing else on the card shows it: the cluster looks healthy right up to the moment it stops. Inactive slots are flagged amber, and on PostgreSQL 13+ the server’s ownwal_statusis shown, withlostin red (that slot’s WAL is already gone and its consumer cannot resume). If the role cannot read the view, the section says so and names the error rather than showing an empty list — “no slots” and “we could not look” must never look the same. Needs PostgreSQL 12 or newer, and proxy agent v1.126.0 or newer when the source is polled through a proxy. - Statement statistics. With
pg_stat_statementsin place the health card grows a Statements button next to Details: the top statements for that database, sortable by total time, calls or mean, with a search box and a row expander that shows the full statement, its source view, and a Copy button for the fingerprint. Every literal is replaced by?before anything is stored or displayed, so the dialog never shows customer data. Know the one thingpg_stat_statementscannot do: it strips comments and keeps only the first text it saw perqueryid, so a per-requesttraceparentis never findable there — only in livepg_stat_activity, which is why Topologix matches on the statement fingerprint instead. - From the trace side, a database span carries the same normalised SQL and fingerprint, and a DB stats lookup on it pulls that statement’s calls, total and mean straight from this integration. Topologix picks the integration by host + database name when it can; to make it explicit, set Database for statement stats on the trace metric source (OTLP or Zipkin) and the lookup always lands here.
More Data & Storage integrations
See it on your own infrastructure
Book a demo and we will walk you through Topologix with your systems in mind: on our cloud, or self-hosted in your own network.