MySQL / MariaDB monitoring with Topologix
Data & Storage
MySQL and MariaDB health from one check suite — connections, buffer pool, slow queries, replication, temp-disk spills, per-database size — plus 18 presets over SHOW GLOBAL STATUS, replica status, and information_schema. Credentials live on the integration; each metric source points at its own host, so one integration covers the whole estate.
Requirements
- A monitoring user with
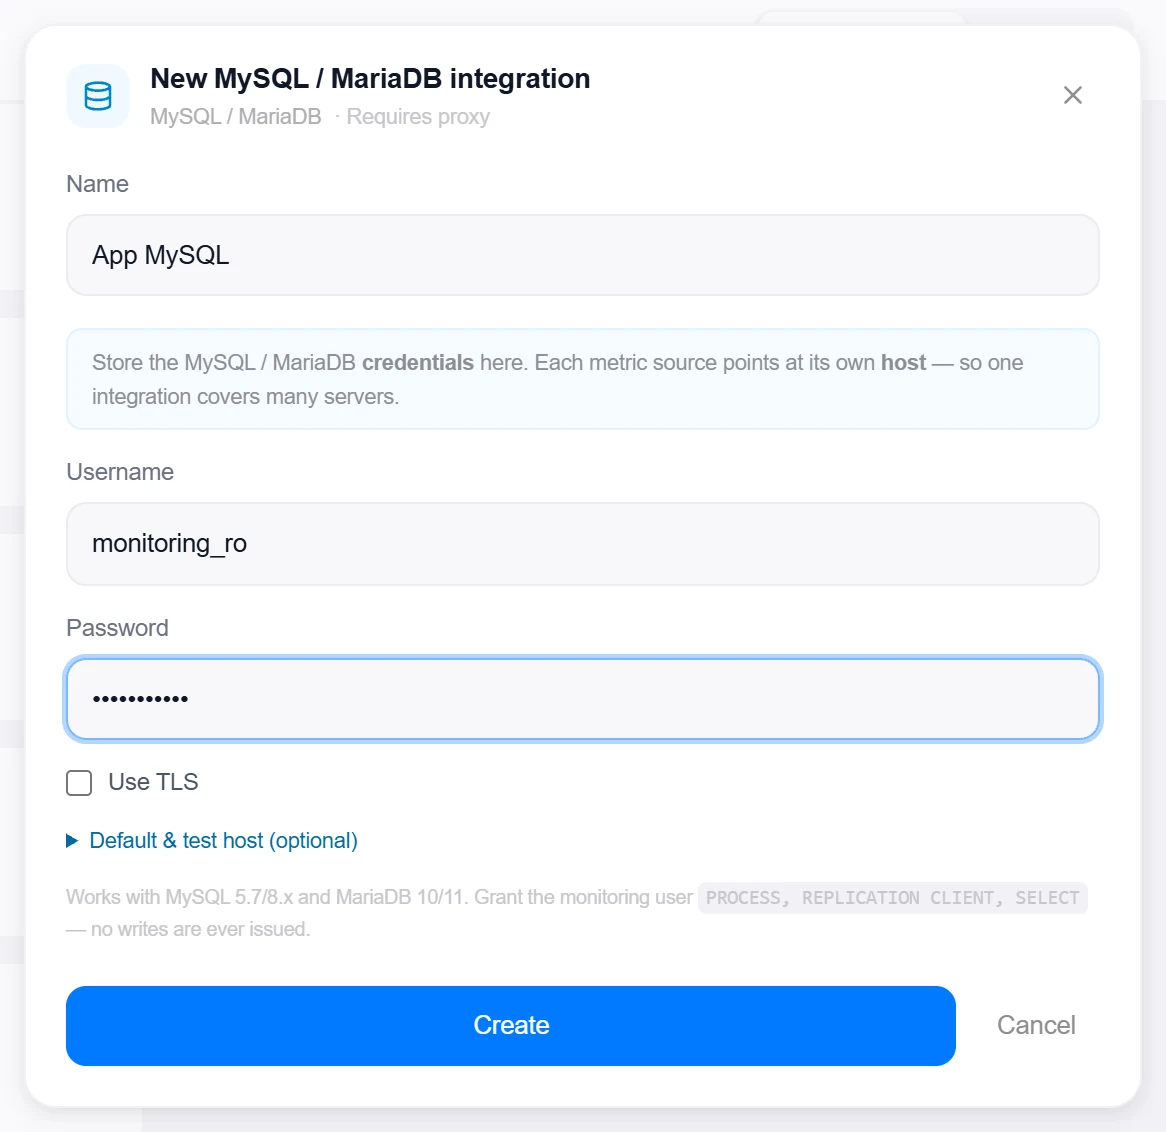
PROCESS, REPLICATION CLIENT, SELECT— no writes are ever issued. On a primary, also grantREPLICATION SLAVEif you want the connected replicas listed by name:SHOW REPLICAS/SHOW SLAVE HOSTSneed it, and each replica must setreport_host; the connected-replica count needs onlyPROCESS. Works with MySQL 5.7/8.x and MariaDB 10/11 (the suite uses SHOW commands, so both flavors run the same checks). - Network reach from the Topologix server or a proxy agent to the database port (default 3306). Use TLS and Allow self-signed certificate toggles cover the usual TLS setups.
1 · Set up the integration
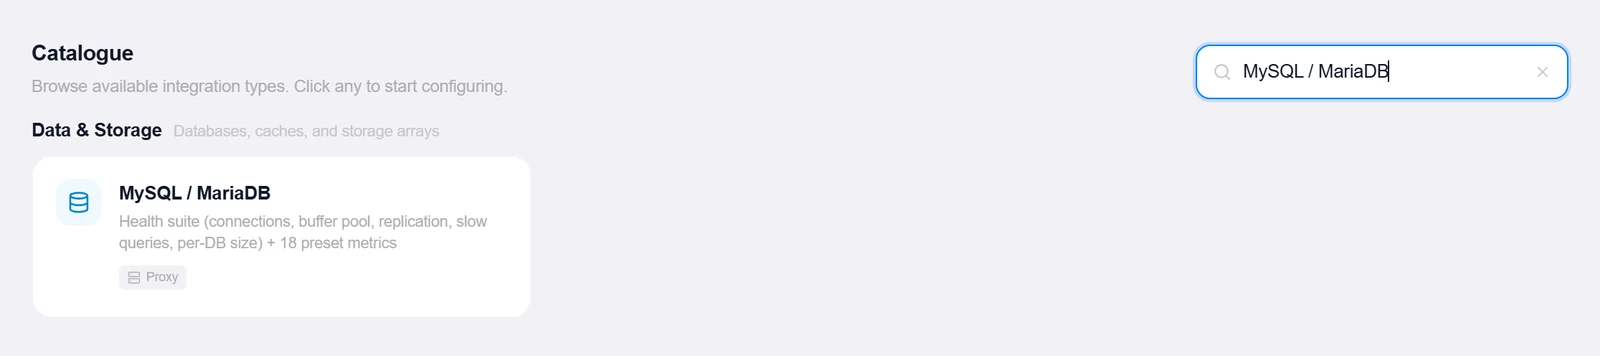
- Open the Integrations pageClick Integrations in the toolbar and pick MySQL / MariaDB from the catalogue.
- Enter the credentialsJust Username and Password — the host lives on each metric source. An optional Default & test host section sets a fallback host and port.
- Create, then verifyClick Create, then reopen the integration and click Test — it connects to the default host, runs
SELECT VERSION(), and reports which flavor answered (“Connected — MariaDB 11.4…”). Failures map to plain language — bad password, unreachable host, or the exact grants to add.
2 · Add it to a flow
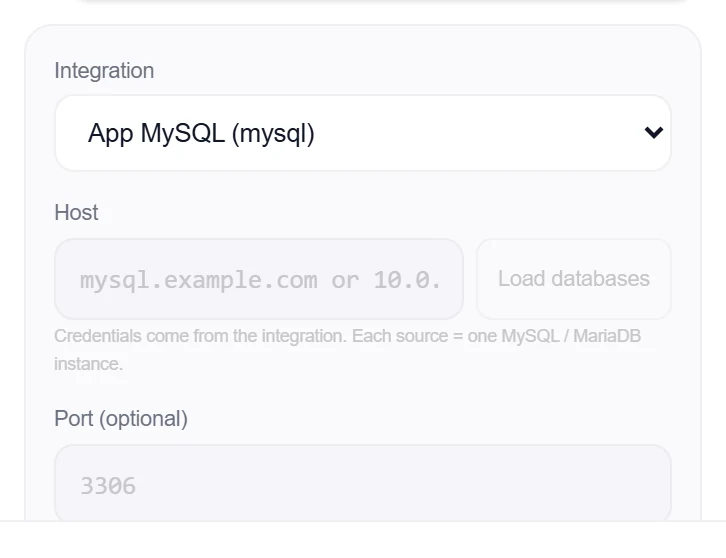
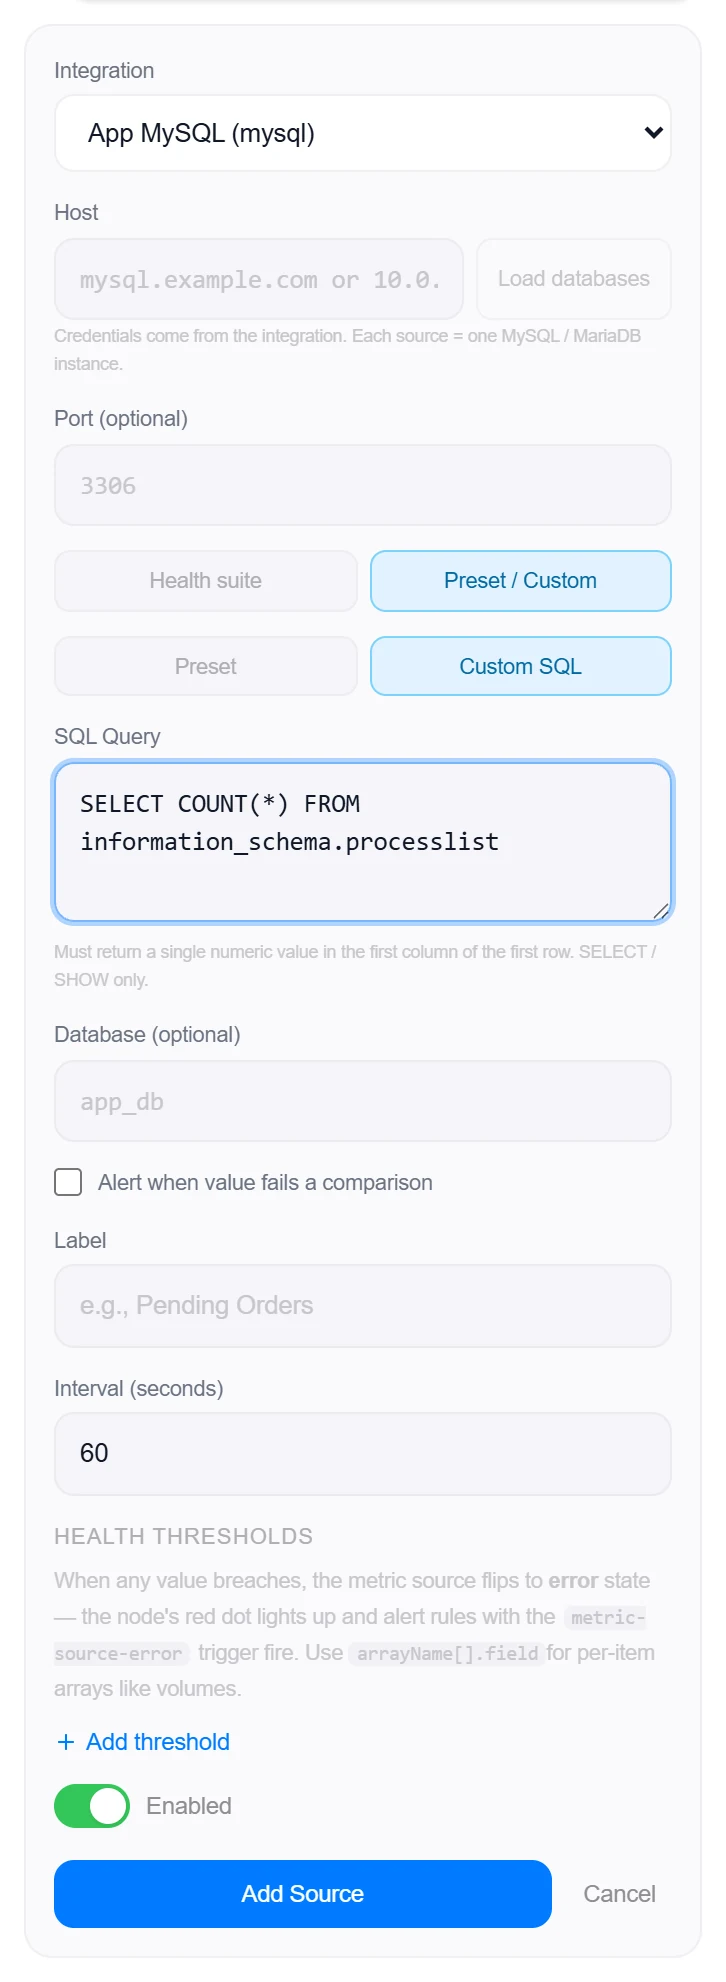
- Select the database nodeClick the node, open Metrics, then + Add and choose the MySQL integration. Enter the Host (and optional port) — Load databases discovers the instance’s schemas for the pickers.
- Pick a modeTwo tabs: Health suite (the default) runs the full check suite; Preset / Custom charts one number instead — a preset from the registry or your own SQL.
- SaveIn health mode, optionally tick databases for a per-database size breakdown (instance checks run once either way). Set the interval and click Add Source.
3 · Beyond presets: custom queries & the All-Services alarm
Health suite
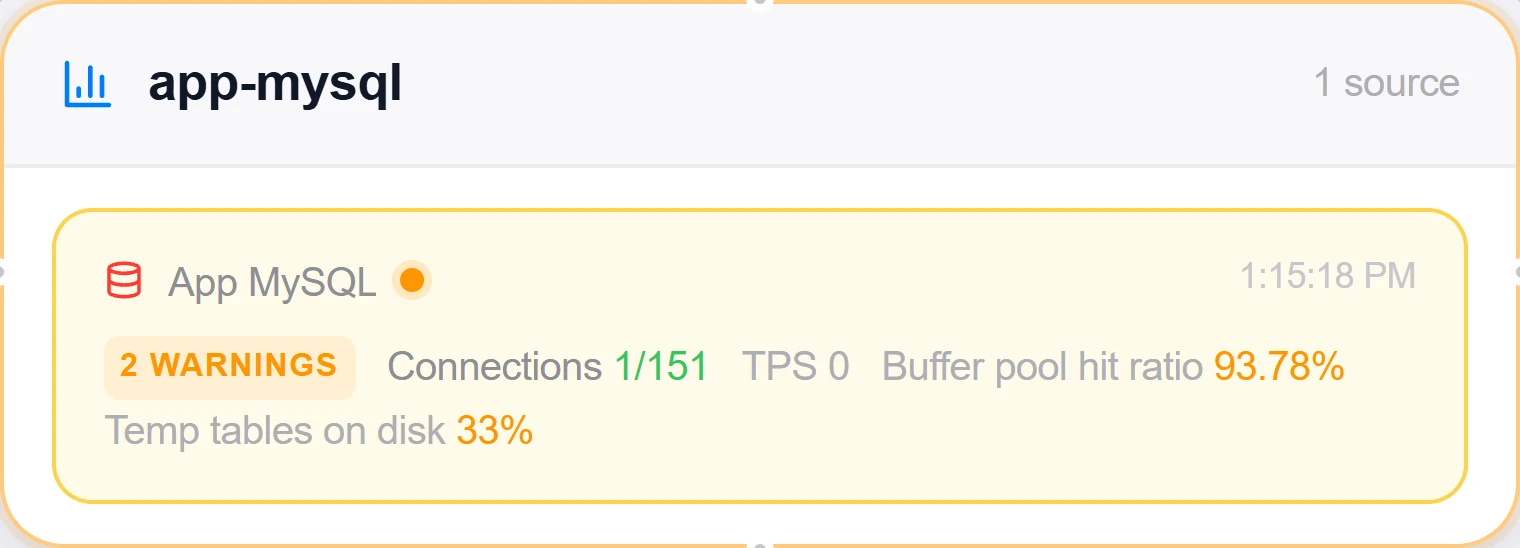
Instance checks run once per poll — connections saturation, threads running, aborted connects, slow queries, buffer pool hit ratio, long-running queries, long-open transactions, row-lock wait average, deadlocks, replication IO/SQL threads and lag, temp tables spilling to disk, open files, and table-lock contention. Selected databases add per-database rows: size plus a non-transactional (MyISAM) table count.
- Counter-based checks (aborted connects, slow queries, temp-disk spill %) are deltas between polls — real rates, not lifetime totals.
- Checks degrade to “n/a” with the reason instead of failing the source — a restricted grant (no PROCESS), a server that isn’t a replica, or MySQL’s missing cumulative deadlock counter (MariaDB-only).
Custom SQL
Inside the Preset / Custom tab, a nested toggle picks Preset or Custom SQL. Custom queries must return a single numeric value in the first column of the first row, and an optional Alert when value fails a comparison assertion (>, <, =, ≠…) turns the card into a pass/fail check on top of the chart.
- SELECT and SHOW only — write keywords are rejected, multi-statement queries are blocked, and
LIMIT 1is appended automatically when missing. - In preset mode, multi-select creates one source per metric in a single pass; per-database presets (database size) bind a schema from the discovered list.
Good to know
- Replication (DB-3). On a replica the suite reads the
SHOW REPLICA STATUS/SHOW SLAVE STATUSrow in full — source host and port, IO and SQL thread state, seconds behind (unknown while the SQL thread is down, never 0), relay-log space and the last error, capped and redacted; with several channels the worst one is reported. On a primary, connected replicas are counted from theBinlog Dumpthreads in the processlist (thePROCESSgrant you already have), their names come fromSHOW REPLICAS/SHOW SLAVE HOSTSonly when the monitoring user also holdsREPLICATION SLAVEand the replicas setreport_host, and retained binary logs are summed fromSHOW BINARY LOGSwhen binary logging is on. On the Databases page every source gains a Replication section on both ends of a link: the primary lists each standby with its lag and what it retains for it, the replica shows the server it replicates from and how far behind it is. Replicas are paired automatically from what the engines report about each other (exact IP, then DNS name, then name) and can be pinned or switched off per source; a replica’s numbers are read from its own source’s stored results, so no credential ever travels between servers. Amber follows the source’s own warn thresholds; red is a categorical failure (a disconnected standby, a stopped thread) or five to ten times the warn level. Proxy agents older than 1.151.0 do not report replication and the section says so rather than reading “standalone”. - One integration, many servers: the host is a per-source field (the iLO model), so adding the next instance is a new source, not a new integration.
- Replication presets read 0 on a server that isn’t a replica, and the binary-logs preset needs binary logging enabled.
- The data-disk-free check can’t be read over SQL — it stays “n/a” unless host metrics are attached via the source’s OS enrichment section (node_exporter / Server Vitals / Zabbix).
More Data & Storage integrations
See it on your own infrastructure
Book a demo and we will walk you through Topologix with your systems in mind: on our cloud, or self-hosted in your own network.