Redis monitoring with Topologix
Data & Storage
Redis server and cluster statistics from a single INFO call per poll — memory, hit ratio, ops/sec, replication health, persistence, and per-database keyspace. Flip on cluster fanout and the same source aggregates every node of a Redis Cluster.
Requirements
- Network reach from the Topologix server or a proxy agent to the Redis port (default 6379; 6380 on TLS-enabled builds).
- Credentials are optional: with
requirepass, fill in only the password; for Redis 6+ ACLs, a dedicated user with+info +@connection(use+@dangerousif you hit NOPERM errors). - For cluster fanout, every node’s address must be reachable — clusters in Kubernetes / Docker / NAT need a proxy agent on the Redis network, because
CLUSTER NODESreturns internal addresses.
1 · Set up the integration
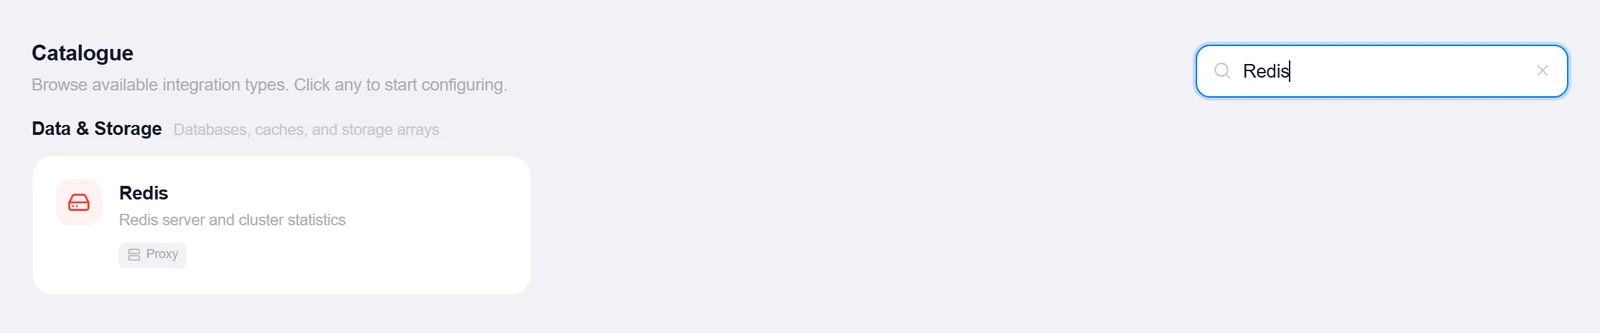
- Open the Integrations pageClick Integrations in the toolbar and pick Redis from the catalogue.
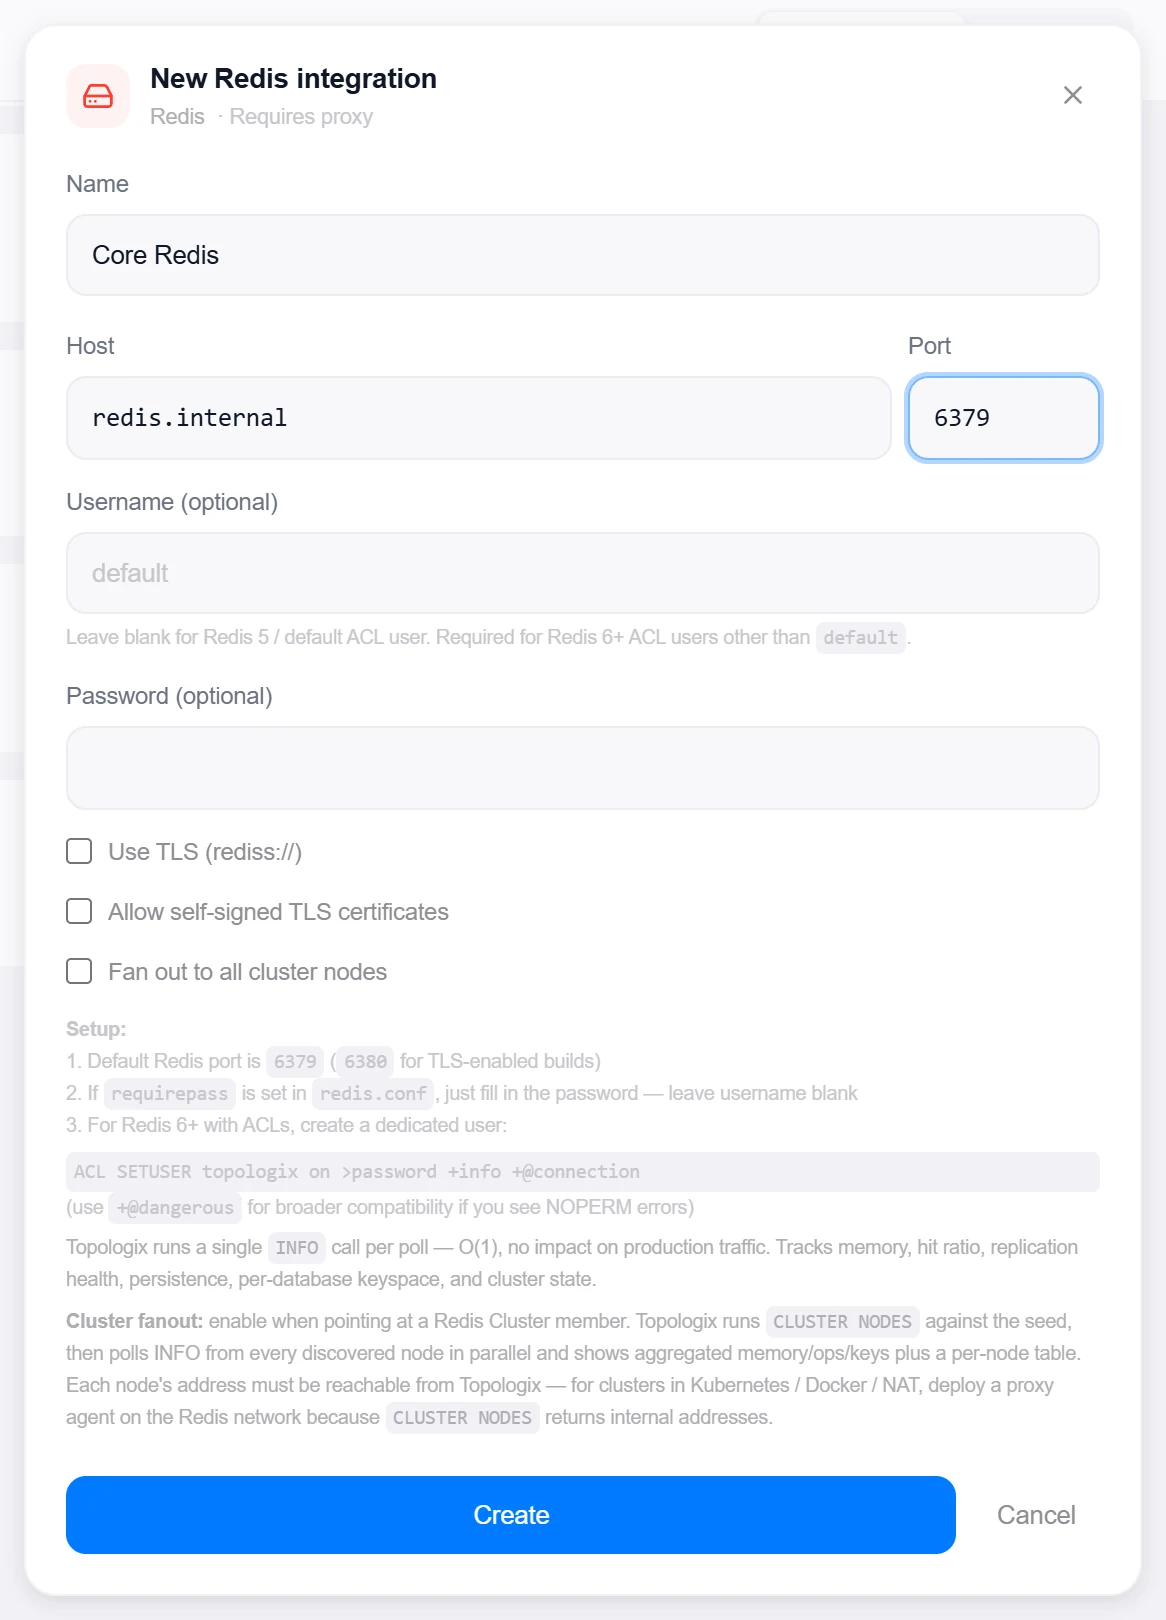
- Enter host and portPlus optional Username and Password — leave the username blank for Redis 5 or the
defaultACL user. - Pick the togglesUse TLS (rediss://) and Allow self-signed TLS certificates as needed; tick Fan out to all cluster nodes when pointing at a Redis Cluster member.
- Create, then verifyClick Create, then reopen the integration and click Test — it reports the Redis version, role, and connected clients; in fanout mode, node reachability, the master/replica breakdown, and slot health.
Target on a private network? Route it through a proxy agent. Proxy agents run inside your network — behind NAT, on a management VLAN, in an air-gapped segment — and reach targets the Topologix server can't. The agent polls the server every 15 seconds for its assignments, runs the checks locally, and pushes results back every 5 seconds, so no inbound firewall rules are ever needed. Set a default proxy on the integration; every metric source can override it. If a proxy goes offline, its sources are marked stale within ~90 seconds and the last known values stay visible.
2 · Add it to a flow
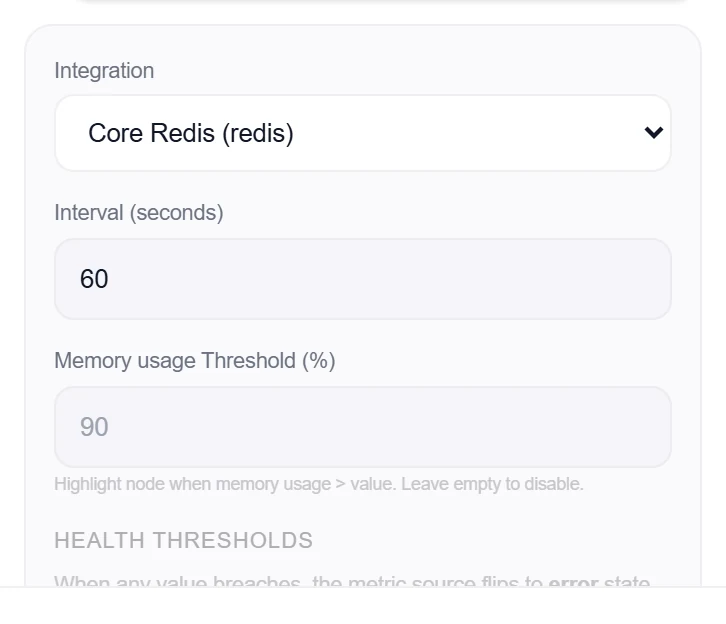
- Select the cache nodeClick the node, open Metrics, then + Add and choose the Redis integration.
- Add the sourceNo per-type options — one source covers the whole server (or, with fanout, the whole cluster).
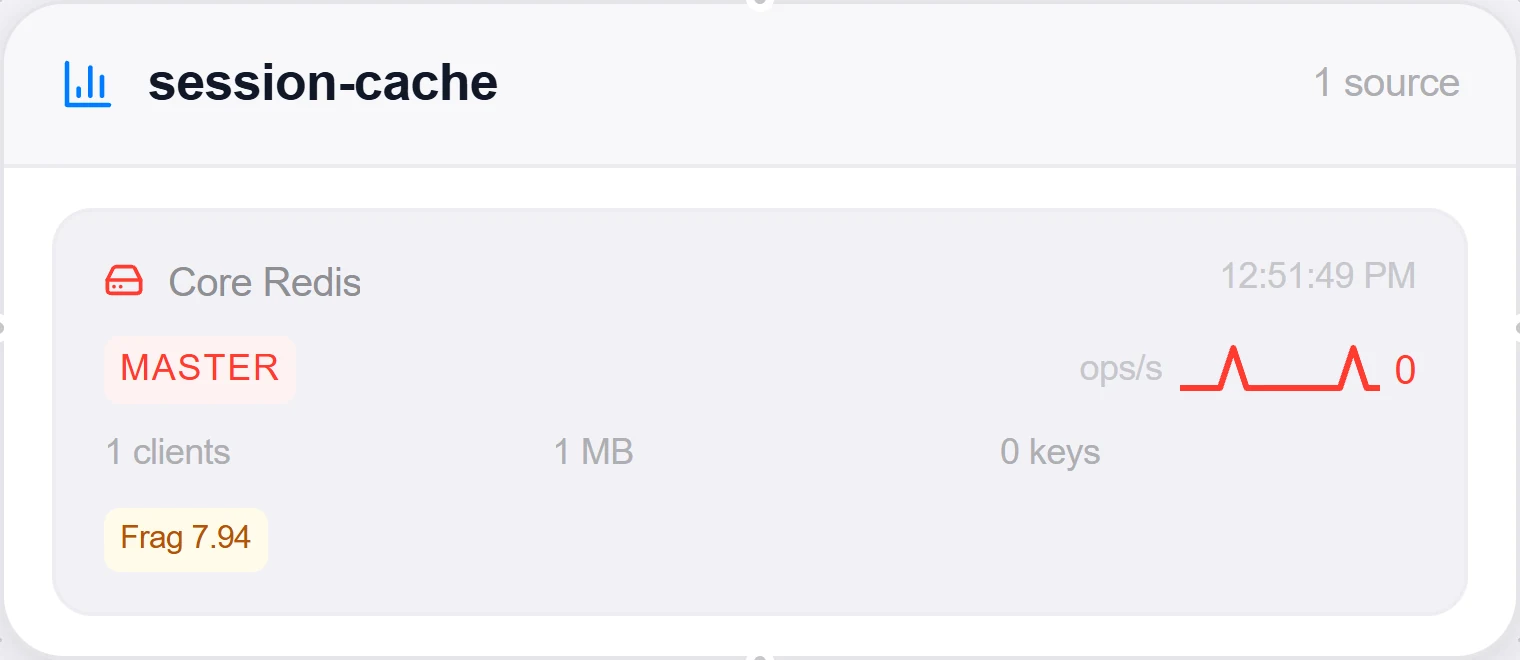
- SaveSet the interval and click Add Source. The card shows memory, hit ratio, ops/sec, replication and keyspace; fanout adds aggregate totals plus a per-node drill-down.
Good to know
- Each poll is one
INFOcall — O(1), no impact on production traffic. Auth failures come back with the real reason (WRONGPASS vs. NOPERM, with the exact ACL grant to add). - Cluster fanout runs
CLUSTER NODESagainst the seed, then pollsINFOfrom every discovered node in parallel; nodes that drop out are reported as unreachable rather than silently vanishing. - Pointing a non-fanout source at a cluster member still works for per-node stats — the fetcher tells you when Redis reports moved slots.
More Data & Storage integrations
See it on your own infrastructure
Book a demo and we will walk you through Topologix with your systems in mind: on our cloud, or self-hosted in your own network.