SSIS monitoring with Topologix
Data & Storage
SQL Server Integration Services package health straight from the SSISDB catalog — running, failed, and succeeded executions, durations, error and warning messages, deployed projects, and success rate — with 14 presets across four categories plus custom T-SQL, over a plain TDS connection.
Requirements
- A real SSIS installation with the SSISDB catalog created (SSMS → Integration Services Catalogs → Create Catalog). A plain SQL Server has no SSISDB — pointing the integration at one fails with “SSISDB not found — is SSIS configured on this server?”.
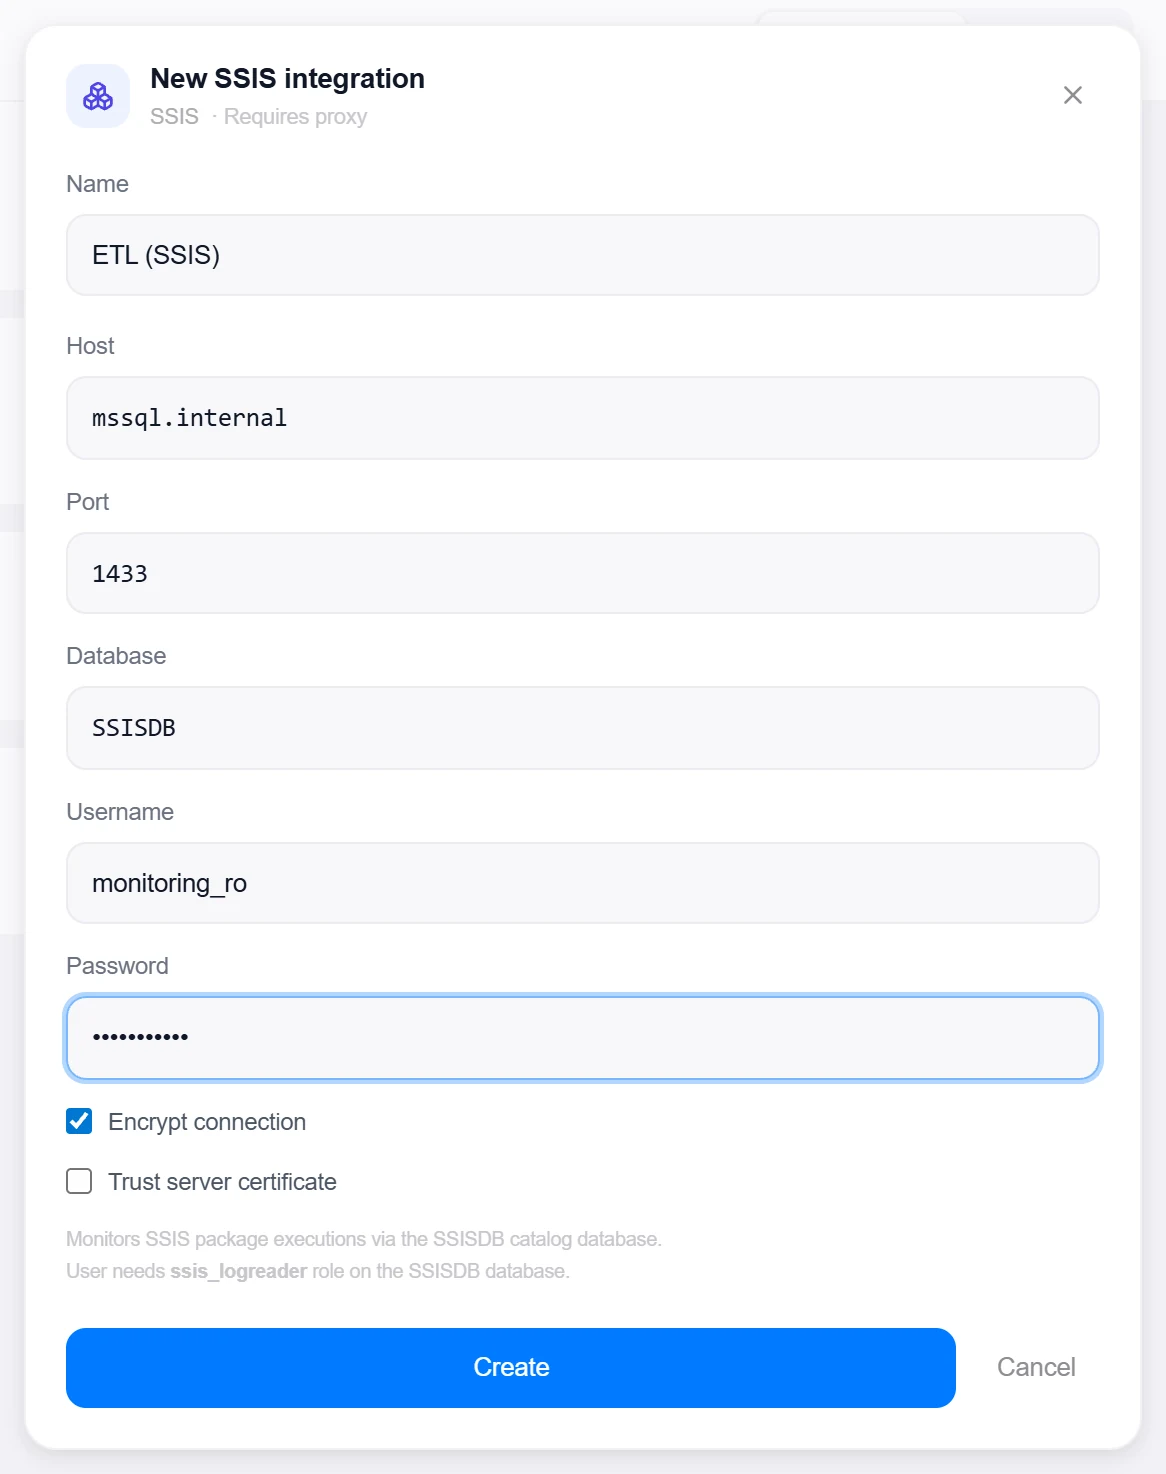
- A SQL login with the ssis_logreader role on the SSISDB database — read-only access to the catalog views is all the presets need.
- TDS reach to the instance port (default 1433) — SSIS servers usually live on a LAN, so this integration is marked Requires proxy in the catalogue; Encrypt connection and Trust server certificate toggles cover the usual TLS setups.
1 · Set up the integration
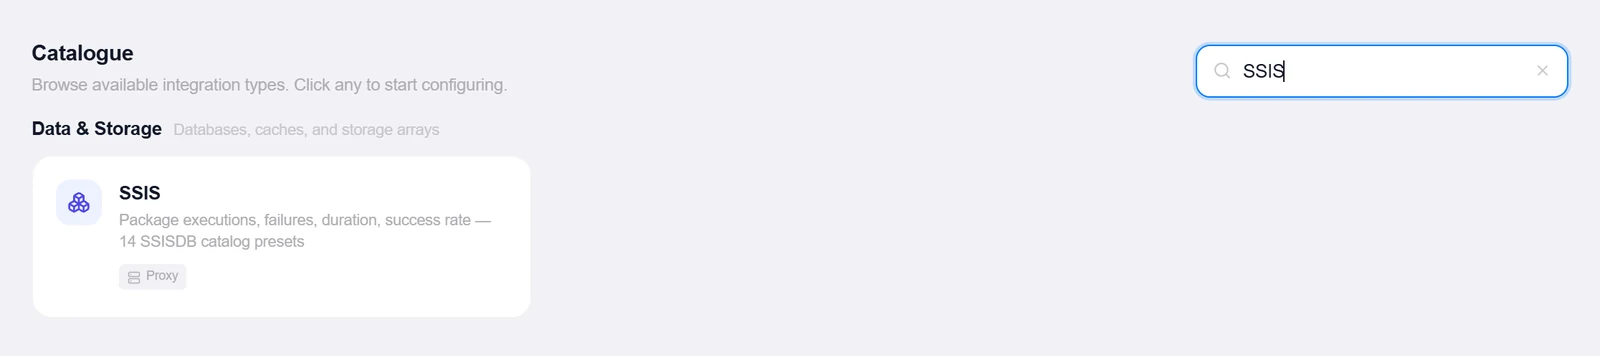
- Open the Integrations pageClick Integrations in the toolbar and pick SSIS from the catalogue.
- Enter the connection detailsHost, Port (1433), Database (defaults to
SSISDB), Username and Password, plus the Encrypt connection and Trust server certificate toggles. - Create, then verifyClick Create, then reopen the integration and click Test — it counts
SSISDB.catalog.projectsand reports “Connected — SSISDB (N projects)”. Failures classify to plain language: login failed, SSISDB not found, or catalog views not accessible — checkssis_logreader.
2 · Add it to a flow
- Select the ETL nodeClick the node, open Metrics, then + Add and choose the SSIS integration.
- Pick a modeTwo tabs: Preset (the default) shows the preset registry grouped by category — multi-select creates one source per metric in a single pass; Custom T-SQL charts a single number from your own query.
- SaveOptionally set a label, pick the interval, and click Add Source.
3 · Beyond presets: custom queries & the All-Services alarm
Preset
The 14 presets read catalog.executions, catalog.operation_messages, catalog.projects, and catalog.packages in four groups: Execution Status (running, failed 24h, succeeded 24h, pending), Performance (average and max duration, longest currently running, total executions 24h), Errors & Warnings (error messages, warning messages, task failures — all 24h), and Catalog (deployed projects, deployed packages, success rate %).
- Presets bind to SSISDB’s own status enum — 2 running, 4 failed, 7 succeeded, 1/5 pending — and to message types 120/110/130 for errors, warnings, and task failures, so the numbers match the catalog views in SSMS exactly.
- All 24-hour windows are computed in UTC against the catalog’s own timestamps.
Custom T-SQL
Any single-value SELECT (or WITH) against SSISDB — the first column of the first row becomes the metric. An optional value assertion (>, <, =, ≥, ≤, ≠) turns the card into a pass/fail check on top of the chart.
- SELECT only — write keywords and
xp_/sp_procedures are rejected, multi-statement queries are blocked, andTOP 1is added automatically when missing. - Custom queries run at
READ UNCOMMITTED, so monitoring never takes locks against a busy catalog.
Good to know
- One source, one number: the card charts a single preset (or custom value) with a sparkline, and the validation assertion — when set — drives pass/fail coloring and alert rules.
More Data & Storage integrations
See it on your own infrastructure
Book a demo and we will walk you through Topologix with your systems in mind: on our cloud, or self-hosted in your own network.